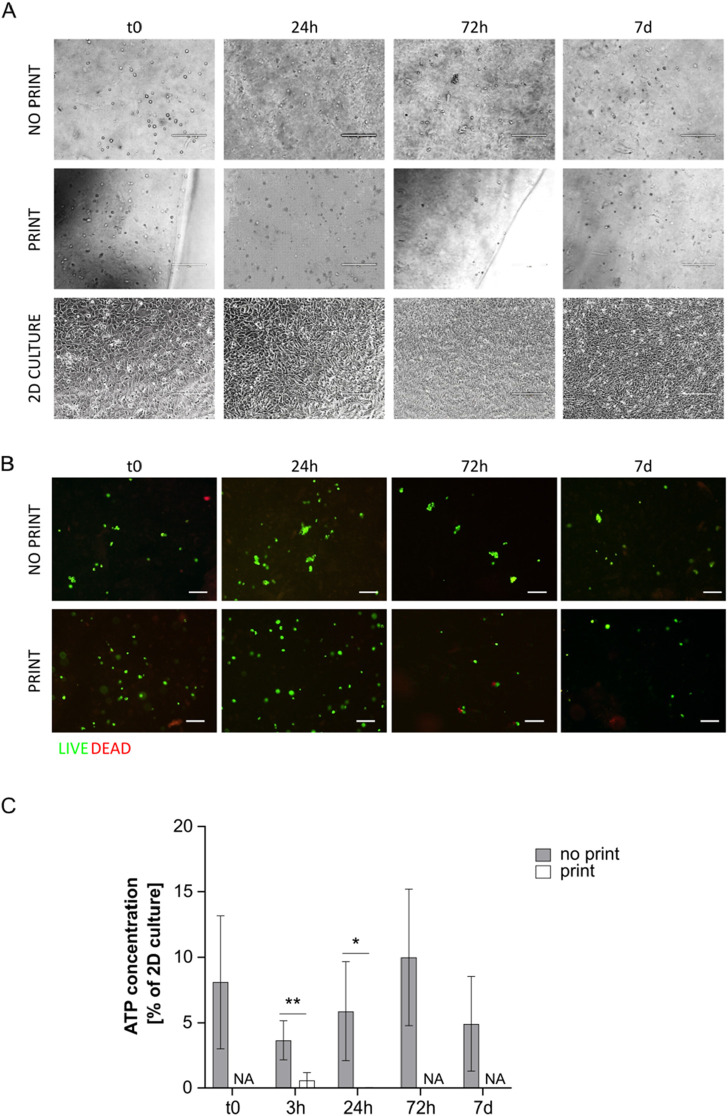
FIGURE 4.
(A) Representative pictures of MS5 cells in not printed and printed G8A7 and in 2D culture at day 0, 24 h, 72 h, and 7 days. Scale bar 200 µm. (B) Live/Dead assay on cell-laden G8A7 hydrogel (both not printed and printed) at t0, 24 h, 72 h, and 7 days. Representative pictures are shown. Scale bar: 100 μm. (C) ATP concentration measurement, expressed as percentage of MS5 cells in 2D culture at t0, in cell-laden G8A7 hydrogel (both not printed and printed) at t0, 3 h, 24 h, 72 h, and 7 days. Results are expressed as mean ± standard deviation (N = 3 print; N = 4 no print); *p < 0.05, **p < 0.01 print vs. no print, Student’s t-test. NA = not available.

