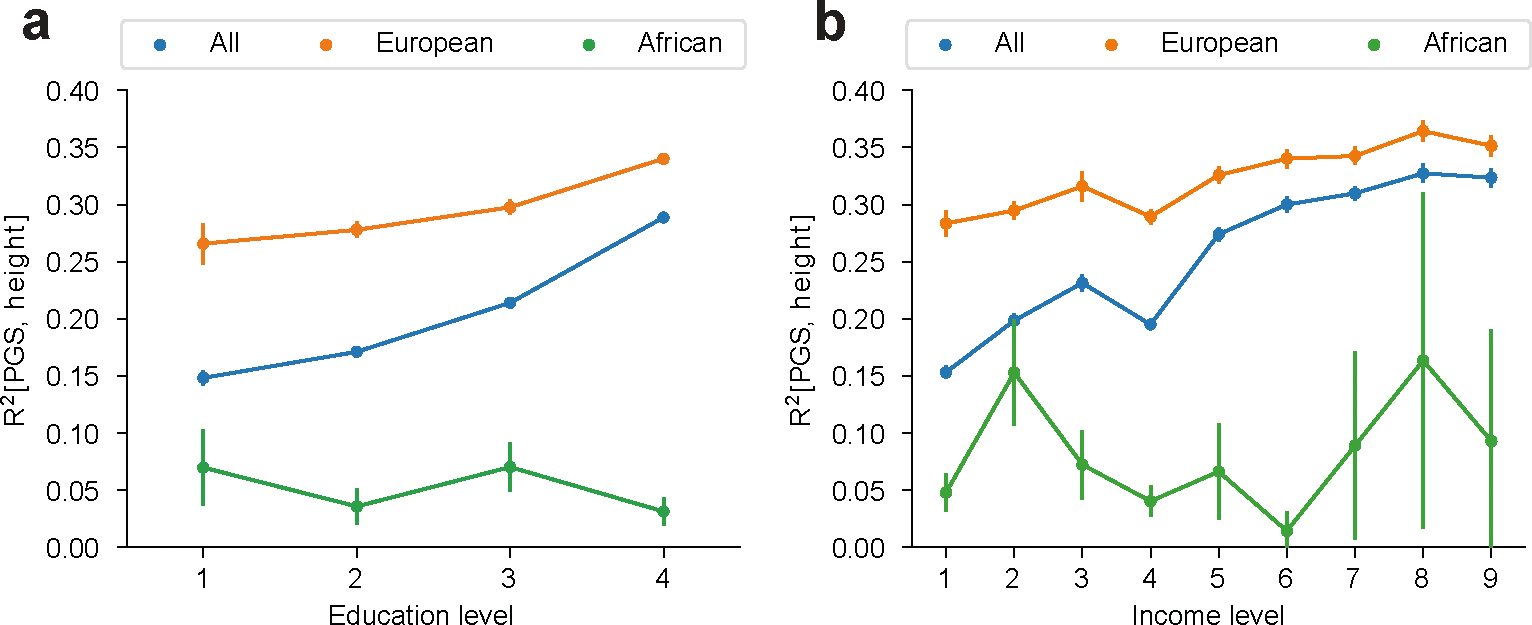
Extended Data Fig. 4 |. between covariate-adjusted height and PGS across education and income levels in All of Us.

were calculated across all individuals, and within individuals of European and African genetic ancestry (with estimated admixture proportion of the corresponding ancestry > 90%), across education levels (a) and income levels (b). Error bars denote mean values +/− standard deviation of across 30 bootstrap samples.
