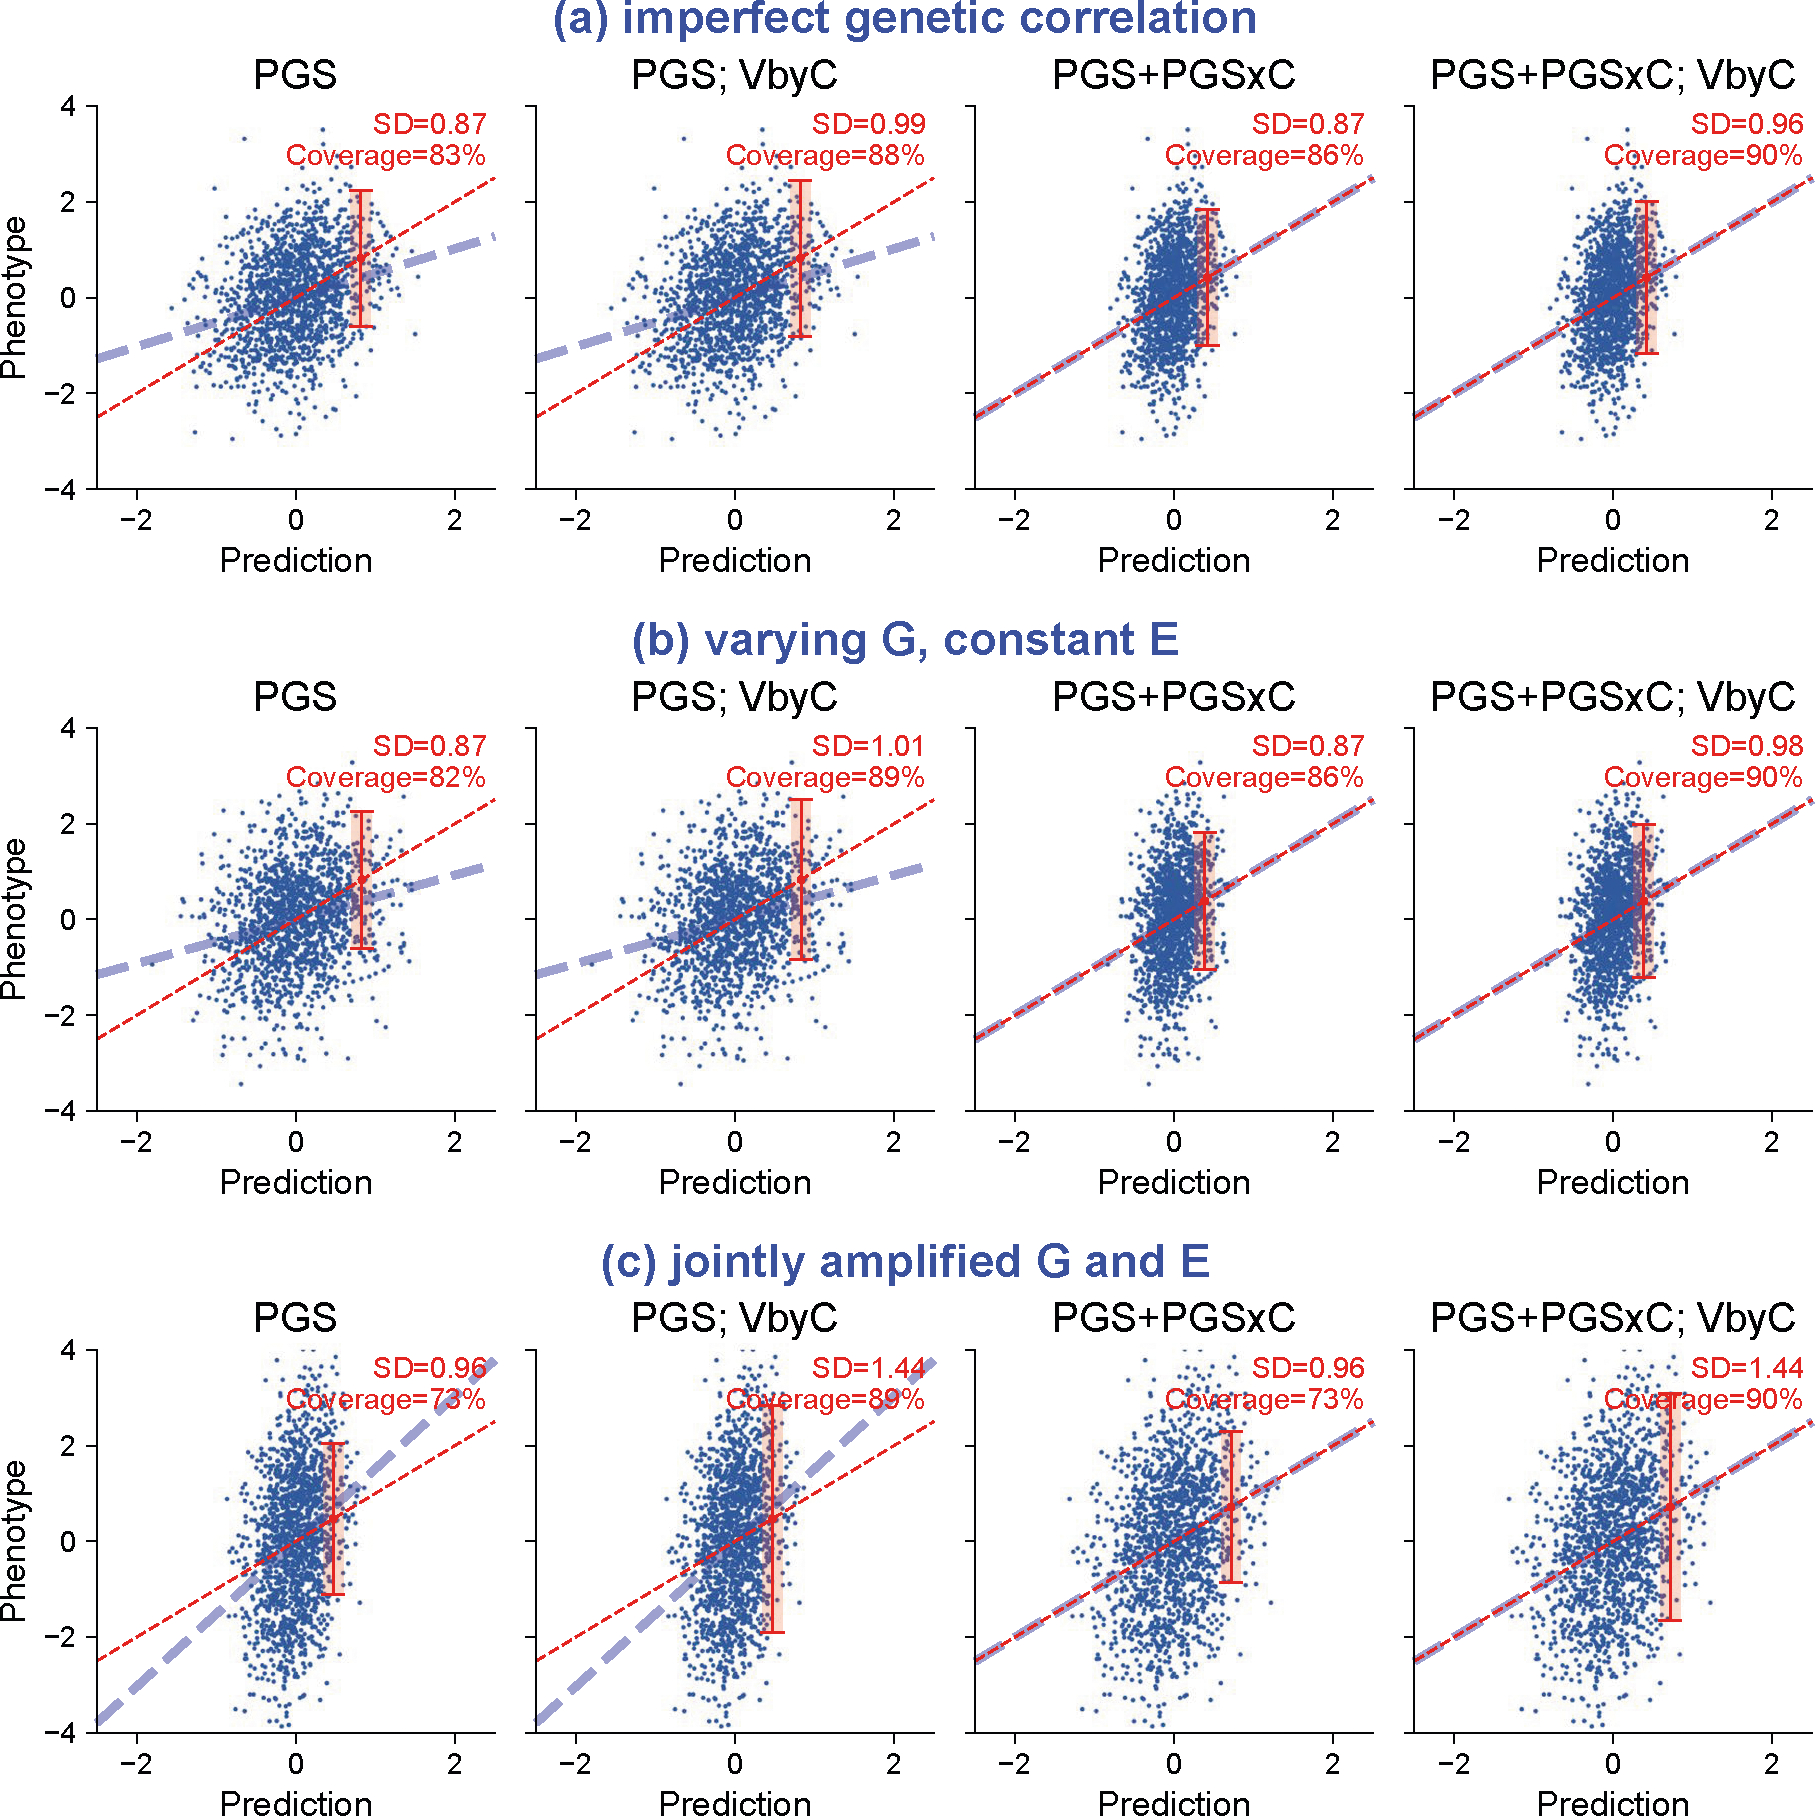
Extended Data Fig. 5 |. Quantitative trait simulations with gene-context interactions.

We simulated three scenarios of gene-context interactions for quantitative traits and evaluated calibration of prediction intervals. These scenarios include (a) imperfect genetic correlation: Var[G] = 0.5, Var[E] = 0.5 in both contexts; genetic correlation=0.5 across contexts. (b) varying heritability: Var[G] = 0.5, Var[E] = 0.5 in context 1 and Var[G] = 0.1, Var[E] = 0.9 in context 2; genetic correlation=1. (c) joint amplified G and E: Var[G] = 0.25, Var[E] = 0.75 in context 1 and Var[G] = 0.25*1.5, Var[E] = 0.75*1.5; genetic correlation=1. Across three scenarios, PGS weights derived in the first context were applied to individuals in both contexts. We show results for individuals in context 2 using four modeling approaches. “PGS’: PGS and prediction variance calculated with individuals from context 1 were applied to individuals in context 2; “PGS; VbyC’: fit y ~ N(PGS, VbyC); “PGS+PGSxC’: fit y ~ N(PGS + PGSxC, prediction variance derived in context 1); “PGS+PGSxC; VbyC’: fit y ~ N(PGS + PGSxC, VbyC). Blue dashed line denotes the best fit to data; red dashed line denotes model predictions; red error bar denotes the prediction interval for an individual at top 5% quantile of PGS. Prediction interval coverage was evaluated within data in top PGS decile. We note these three simulation scenarios did not cover all possible modes of gene-context interactions: these models assume gene-context interactions act similarly across all causal variants, and they model gene-context interactions using PGSxC and VbyC.
