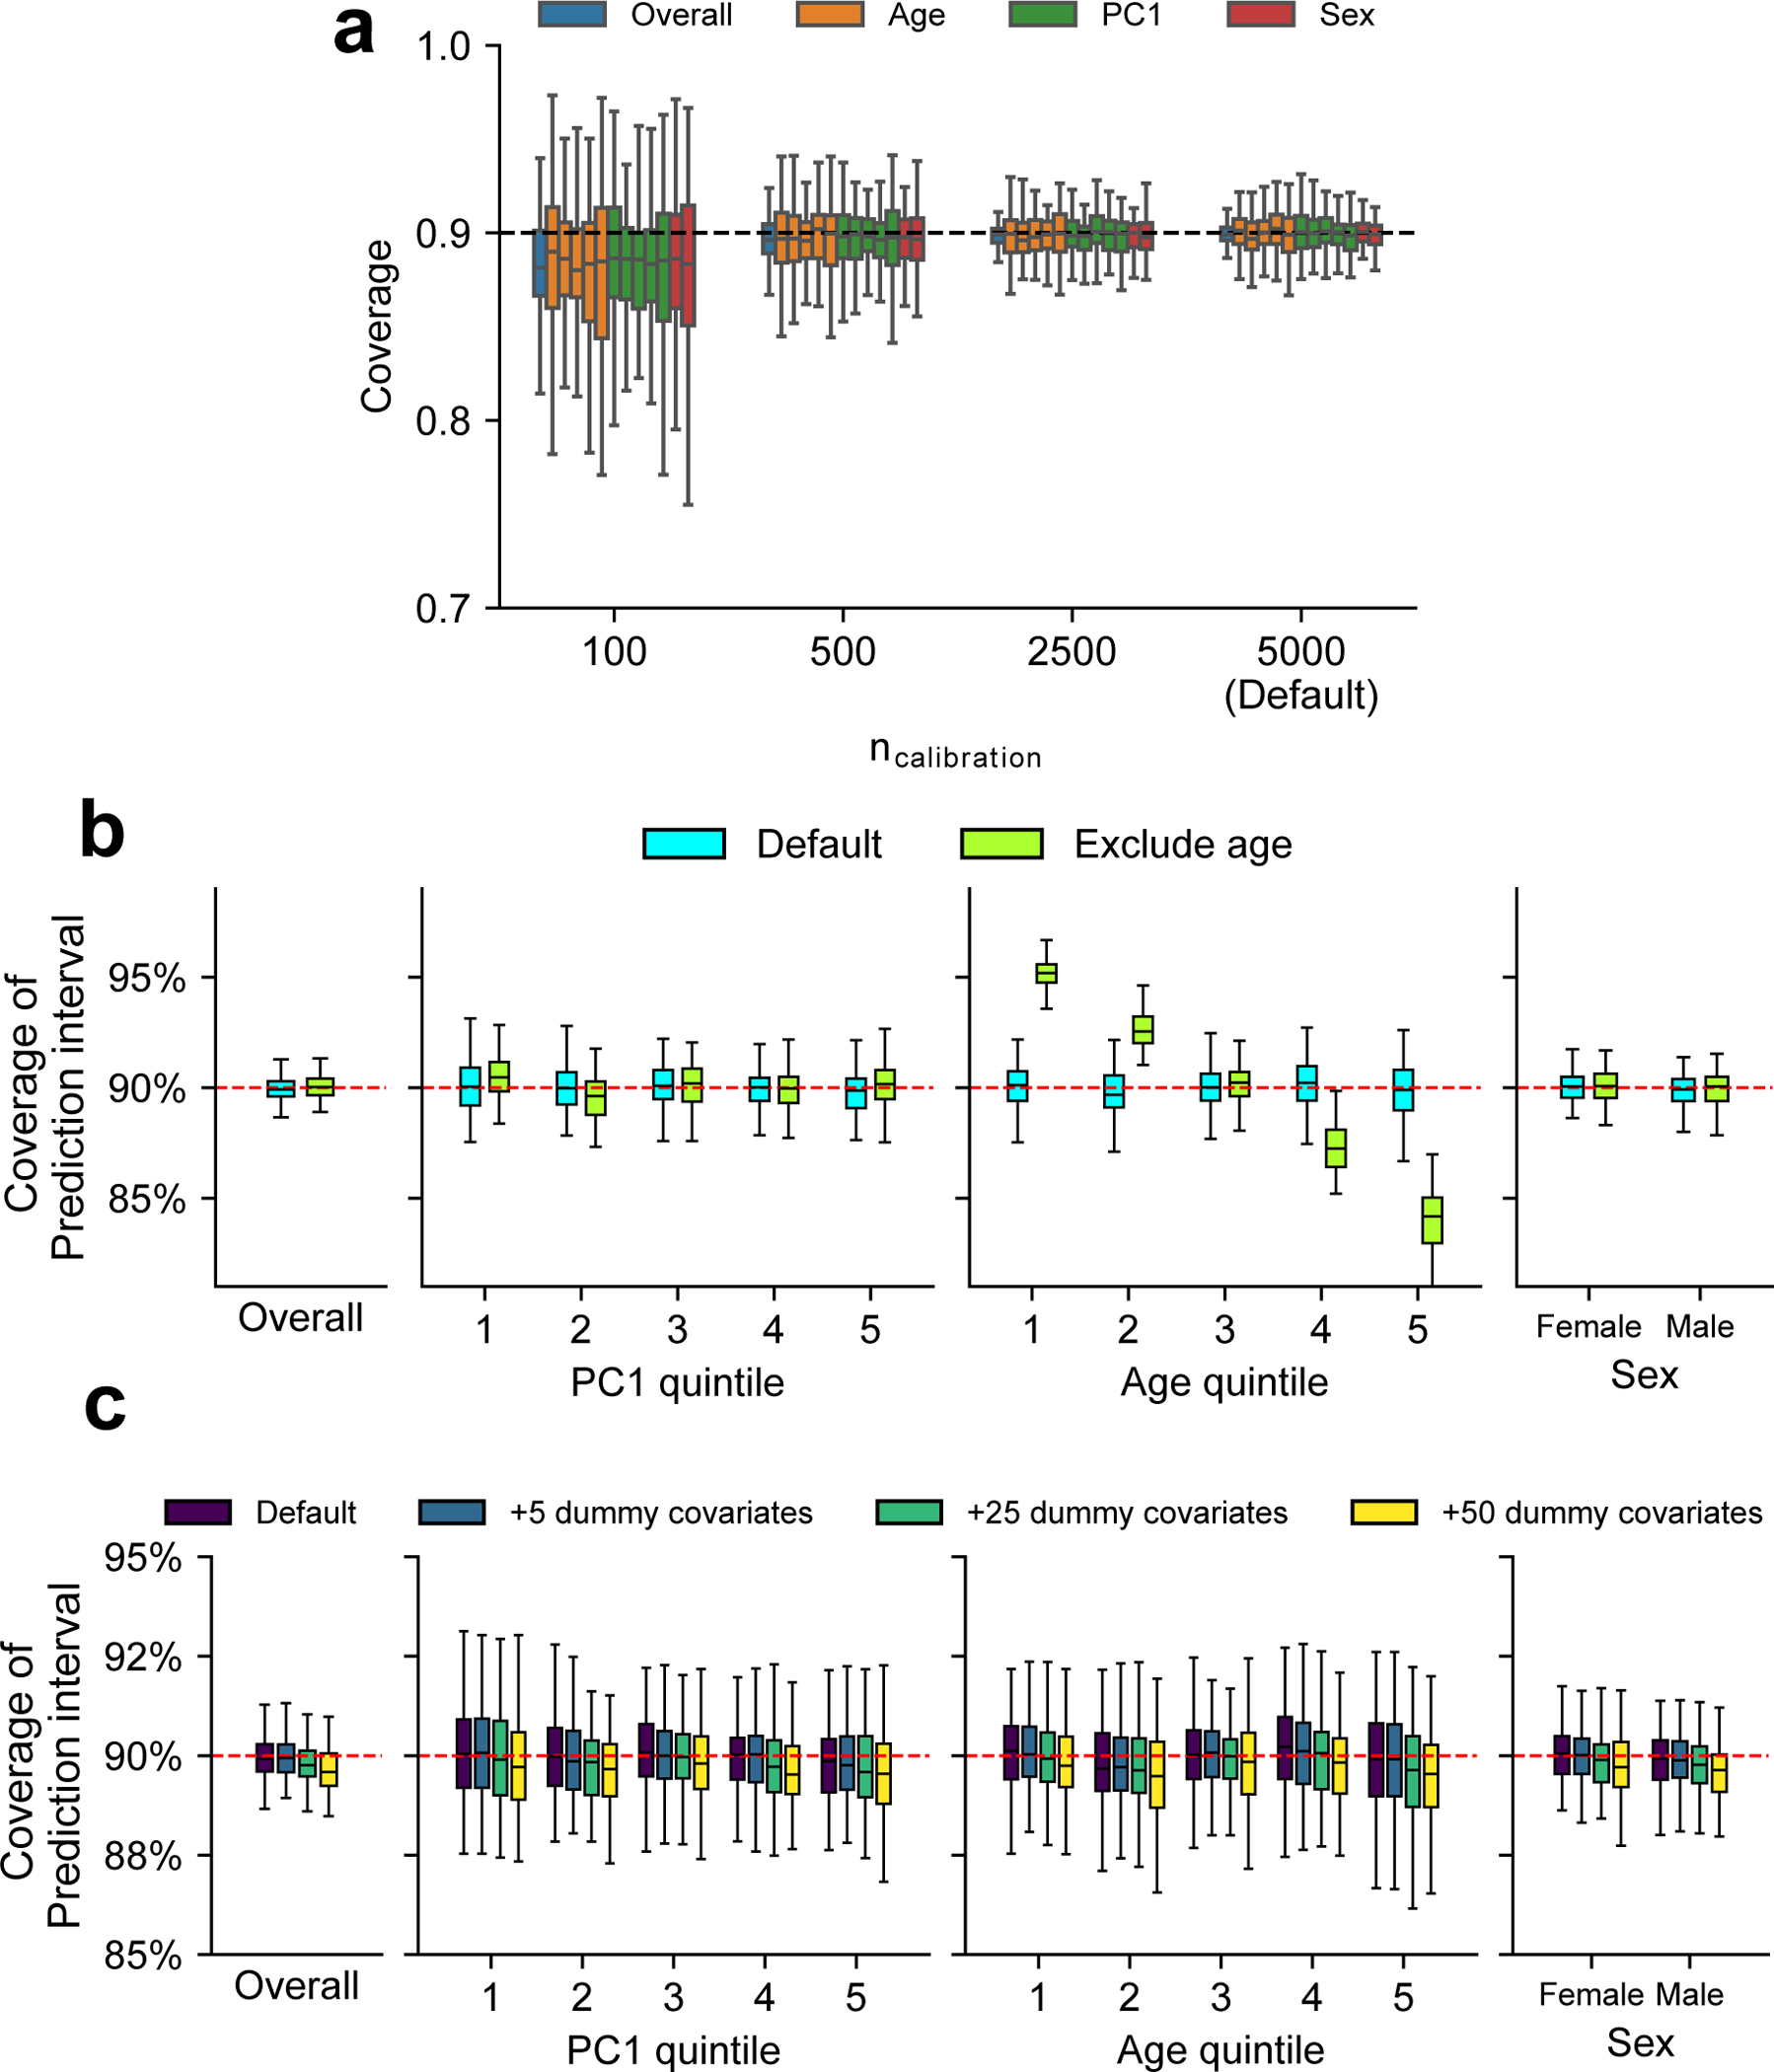
Extended Data Fig. 7 |. Simulations with varying number of individuals, unmeasured contexts, excessive dummy contexts.

We performed simulations to investigate factors that influence coverage of prediction intervals. We compared coverage in these alternative scenarios with default scenario (marked by ‘Default’ in the figure) where we performed calibration using age, PC1, and sex and 5000 individuals as calibration data (same as Fig. 5). (a) Coverage of prediction intervals with varying number of individuals used in calibration (). We evaluated the coverage both at the overall level and within each group (groups are denoted by colors) using 5,000 testing individuals. Different box plots with the same color denotes different strata for each context (quintile for age and PC1; male/female for sex). We determined coverages had more downward bias and higher variance when less individuals are used in the calibration. (b) Coverage of prediction intervals when certain context variables were not measured. To simulate unmeasured covariate, we performed calibration using PC1 and sex only (excluding age). And we determined prediction intervals were mis-calibrated along the unmeasured context of age in this scenario. (c) Coverage of prediction intervals when including excessive dummy contexts in calibration. We simulated dummy variables with no effects to phenotype variance (number of dummy covariates ; drawn from N(0,1)) and included them in calibration to investigate the effect of including excessive covariates to prediction coverage. We determined coverages had more downward bias and higher variance when more dummy variables were used in the calibration. For (a-c), each box plot contains results across 100 simulations (each box contains n = 100 points). For box plots, the center corresponds to the median; the box represents the first and third quartiles of the points; the whiskers represent the minimum and maximum points located within 1.5× interquartile ranges from the first and third quartiles, respectively.
