
Fig. 2 |. Widespread context-specific PGS prediction accuracy in UK Biobank.
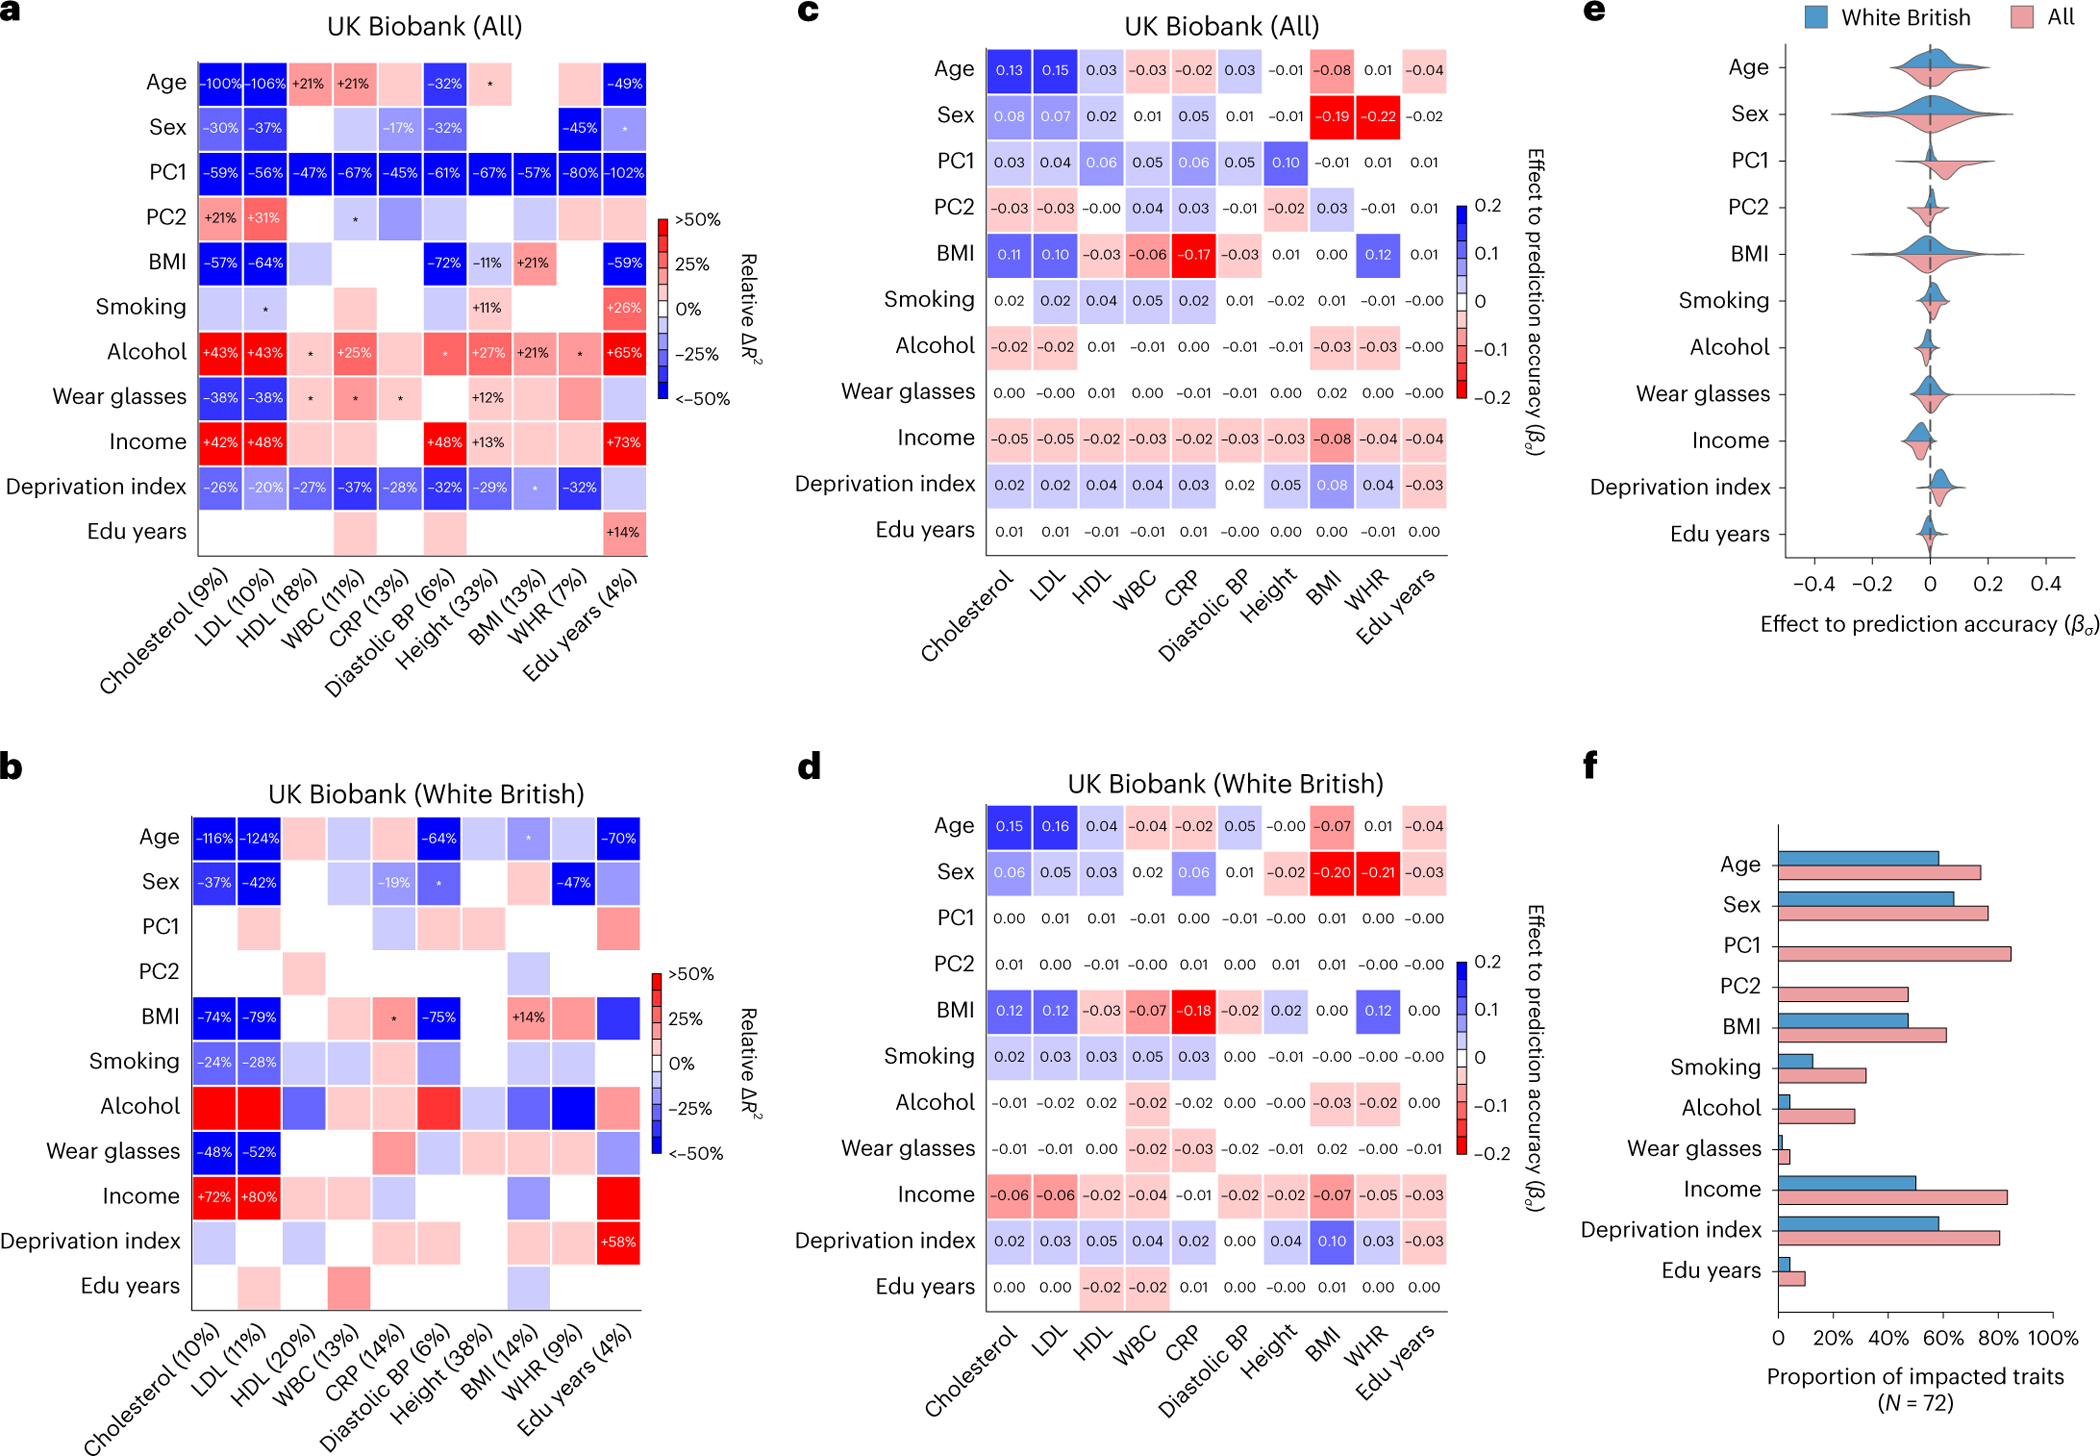
a,b, Heatmaps for context-specific PGS accuracy for all individuals (a) and WB individuals (b). Each row denotes a context and each column denotes a trait; the squared correlation between PGS and residual phenotype () is shown in parentheses. Heatmap color denotes the PGS phenotype relative (defined as ), where represents computed in a given range of the context variable. For continuous contexts, relative denotes differences of top quintile minus bottom quintile; for binary contexts (including sex, smoking, wear glasses and alcohol), relative denotes differences of male minus female, smoking minus not smoking, wearing glasses minus not wearing glasses, drinking alcohol minus not drinking alcohol (these orders were arbitrarily chosen). Numerical values of relative differences are displayed for PGS–context pairs with statistically significant differences (multiple testing correction for all 10 × 11 PGS–context pairs in this figure; two-sided P < 0.05/(10 × 11)). *PGS–context pairs with nominally significant differences (multiple testing correction for 11 contexts; two-sided P < 0.05/11). c,d, Heatmaps of effects to prediction accuracy in CalPred model (estimated ) for all individuals (c) and WB individuals (d). Colormaps were inversed to those of a and b to reflect that positive corresponds to lower prediction accuracy and vice versa. e, Distribution of estimated in the CalPred model for each context across traits. f, Number of significantly impacted traits by each context (two-sided P < 0.05/(72 × 11)). CRP, C-reactive protein; BP, blood pressure; Edu, education.