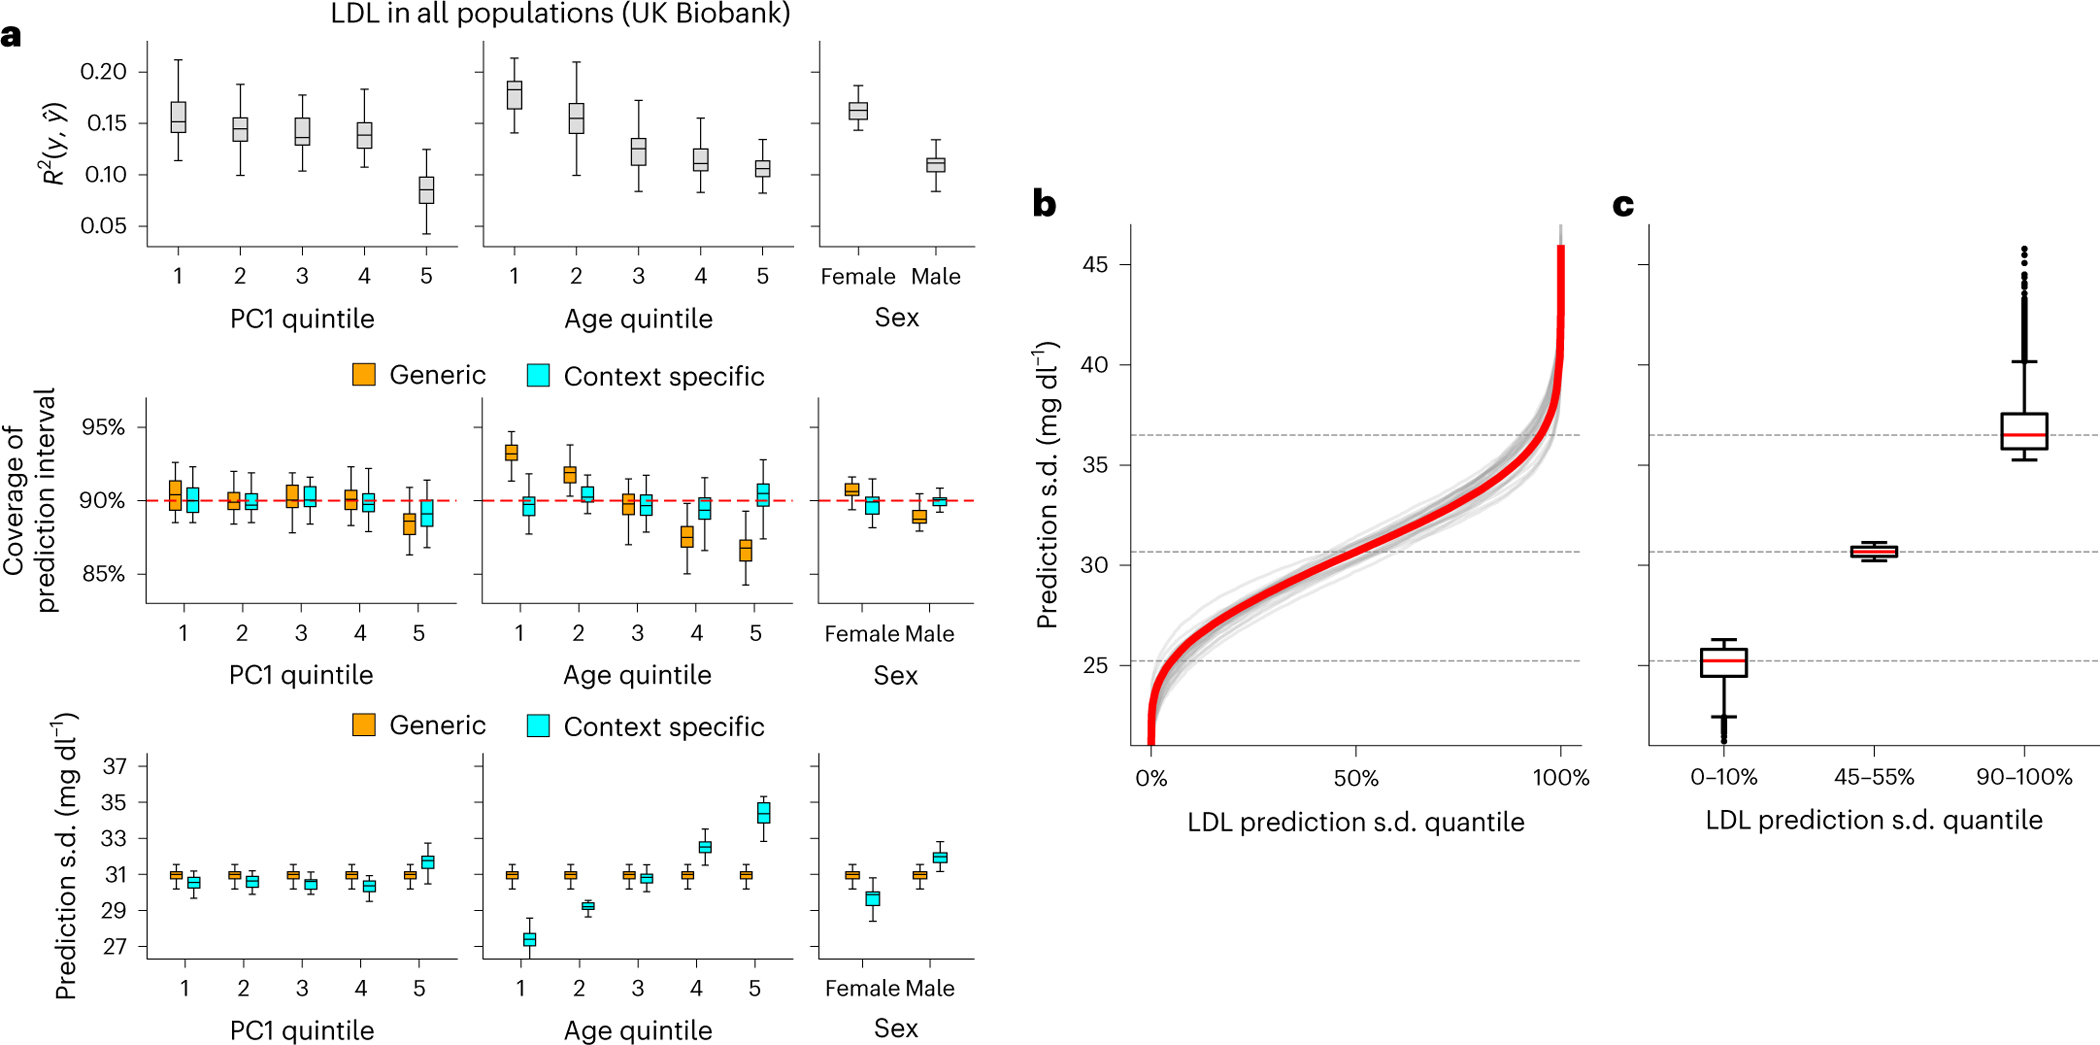
Fig. 6 |. CalPred PGS calibration of LDL in UK Biobank.

a, Top: prediction between phenotype and point predictions (incorporating PGS and other covariates) in each subgroup of individuals stratified by context ( evaluated across all individuals is 0.147). Middle: coverage of generic (orange) versus context-specific (blue) 90% prediction intervals evaluated in each context subgroup. Generic intervals were obtained by applying CalPred without context information; context-specific intervals were obtained by applying CalPred together with context information. Bottom: average length of generic versus context-specific 90% prediction intervals in each context. Each box plot contains , coverage or average length across 30 random samples with each sample of 5,000 training and 5,000 target individuals (n = 30 points for each box). b, Ordered LDL prediction s.d. in the unit of mg dl−1. Gray lines denote prediction s.d. obtained with random sample of 5,000 training and applied to 5,000 target individuals. Red lines denote prediction s.d. obtained from all individuals. c, Box plots of results in b from individuals of LDL prediction s.d. quantile of 0–10%, 45–55% and 90–100% (n = 110,000 individuals in total). For box plots in both a and c, the center corresponds to the median, the box represents the first and third quartiles of the points, and the whiskers represent the minimum and maximum points located within 1.5× interquartile range from the first and third quartiles, respectively.
