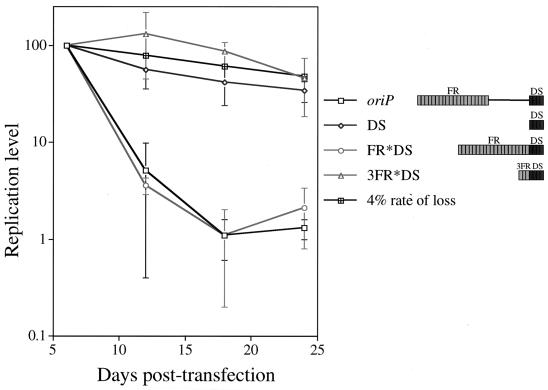
FIG. 8.
Spacing between the FR and DS of oriP has no effect on establishment of the replicon. The 963 nucleotides separating the FR and DS of oriP were deleted in the context of the oriP test plasmid and the 3FR+DS plasmid, the resulting plasmids (FR*DS and 3FR*DS, respectively) were introduced into 293/EBNA-1 cells, and the level of replicated DNA was monitored over 24 days posttransfection as described in the legend to Fig. 3A. The oriP and DS plasmids were analyzed in four independent experiments conducted in parallel to the oriP plasmid derivatives shown. (The data are also presented in Fig. 7A and 7B, as all oriP plasmid derivatives were analyzed simultaneously.) The replication level of these plasmids was plotted versus the days posttransfection. For each of four independent experiments, the level of replicated test plasmid detected at 6 days posttransfection was set to 100%, and the replication level at later times was set relative to this point (100% = 625 ± 121 oriP, 967 ± 258 DS, 439 ± 222 FR*DS, and 817 ± 576 3FR*DS molecules per transfected cell). The 3FR*DS data are representative of three independent experiments except for the day 24 time point, which is representative of two experiments. The 4% rate-of-loss curve, depicted by black cross-hatched boxes, is theoretical and is based on previous studies of established, drug-resistant cell clones (29, 56).

