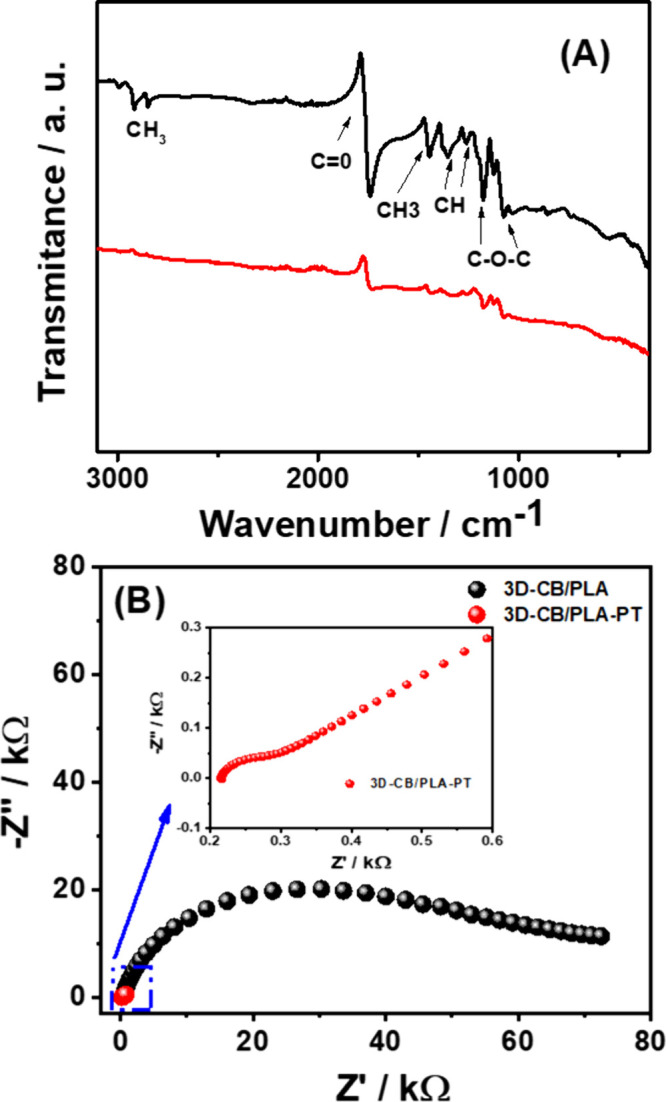
Figure 3.

(A) FTIR spectra of the 3D-CB/PLA (black line) and 3D-CB/PLA–PT (red line); (B) Nyquist diagram of impedance spectra at +0.22 V of the 3D-CB/PLA (black dots) and 3D-CB/PLA–PT (red dots) electrodes in the presence of 2 mM [Fe(CN)6]3–/4– in 0.1 M KCl solution.
