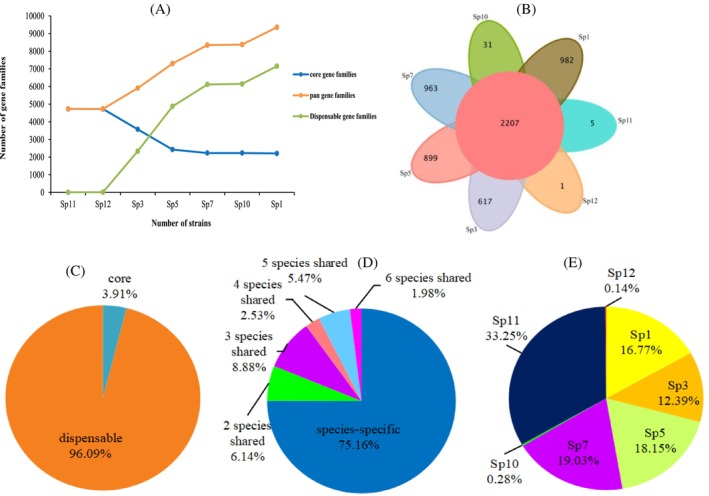
FIGURE 5.

Pan‐genome analyse for Pseudomonas. (A) was line chart of the number of gene families; (B) represented petal chart of the number of gene families; the proportion of core genome (C); variable genome of species shared (D) and specific genome (E) of seven strains.
