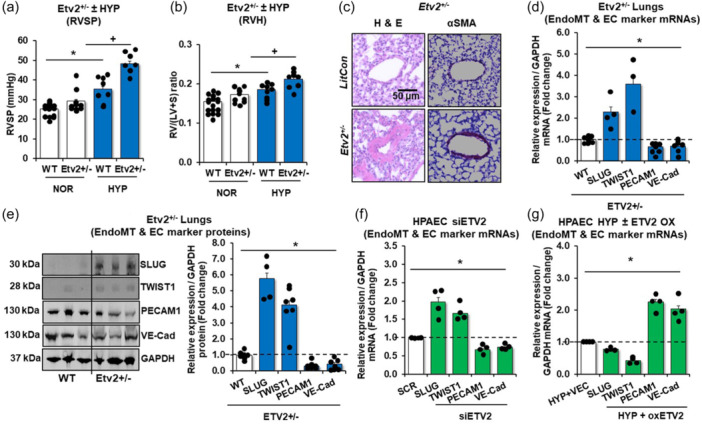
Figure 2.

Reduction of ETV2 leads to the development of PH with increased expression of mesenchymal markers. Etv2 +/− and littermate control (WT) mice were exposed to normoxic (21%) with sugen (NOR/SU, 20 mg/kg) or hypoxic (10% O2)/sugen (HYP/SU) mice for 3‐weeks. (a) Right ventricular systolic pressure (RVSP) was recorded in anesthetized mice with a pressure transducer. Each bar represents the mean RVSP in mmHg ± SE. n = 7–17/group. (b) The ratio of the weight of the right ventricle to the left ventricle + septum [RV: (LV + S)] is presented as an index of right ventricular hypertrophy (RVH). n = 8–9/group. (c) Representative images of small mouse arterioles following H&E or αSMA staining. (d, e) Levels of lung EndoMT or EC markers were measured with qRT‐PCR (d) or with Western blot analysis (e). The qRT‐PCR results were expressed relative to GAPDH mRNA and Western blot analysis results to GAPDH protein ± SE as fold‐change versus CON. *p < 0.05 vs NOR, n = 3‐7/group. (f) For ETV2 knockdown experiments, HPAECs were treated with scrambled (SCR) or ETV2 (20 nM) siRNAs for 6 h then incubated for an additional 72 h. Each bar represents mean ± SE. EndoMT or EC markers level relative to GAPDH were expressed as fold‐change vs cells treated with SCR. n = 3–6/group. P value *p < 0.05 vs SCR. (g) For ETV2 gain of function, HPAECs were treated with ETV2 plasmid constructs (oxETV2, 1 µg) or vector (VEC) constructs for 6 h, then incubated for an additional 72 h of normoxia (NOR) or hypoxia (HYP) exposure. qRT‐PCR was performed for EndoMT, or EC markers. Each bar represents mean ± SE EndoMT or EC markers level relative to GAPDH expressed as fold‐change vs cells treated with VEC. n = 3–6/group, *p < 0.05 vs HYP/VEC.
