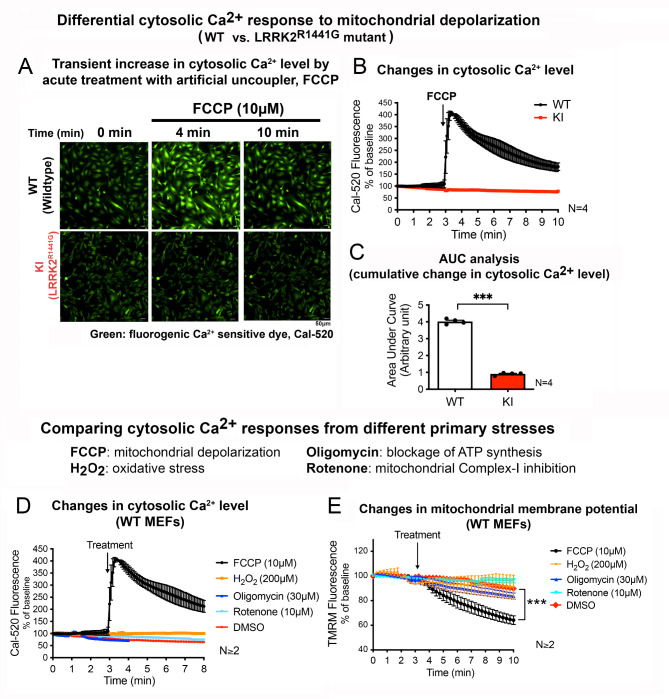
Fig. 1.
Depolarization of mitochondria induces transient cytosolic Ca2+ surge which is disrupted by LRRK2R1441G mutation
(A) Representative fluorescent microscopic image of WT and KI MEFs stained with Cal-520 at baseline (t = 0 min), and 1 min after the addition of FCCP (t = 4 min), and at final imaging timepoint (t = 10 min). Relative cytosolic Ca2+ level is indicated by the intensity of green fluorescence (Cal-520). Scale bar: 50 μm. (B) Real-time tracing of the Cal-520 fluorescence intensity of MEFs after addition of FCCP (10 µM), normalized by its own baseline (N = 4 experiments). (C) Area under curve (AUC) analysis of changes in cytosolic Ca2+ level after FCCP treatment from t = 3 to 10 min (N = 4 experiments). (D) Real-time tracing of the Cal-520 fluorescence intensity in WT MEFs after addition of different mitochondrial toxins: FCCP, H2O2, oligomycin and rotenone, normalized by its own baseline (N ≥ 2 experiments). (E) Real-time tracing of TMRM intensity of WT MEFs at baseline for 3 min, followed by the addition of different mitochondrial toxins (N ≥ 2 experiments). Data are presented as mean ± SEM. Statistical analyses: (C) Unpaired parametric Student’s t-test; (E) Paired parametric Student’s t-test. ***p < 0.001

