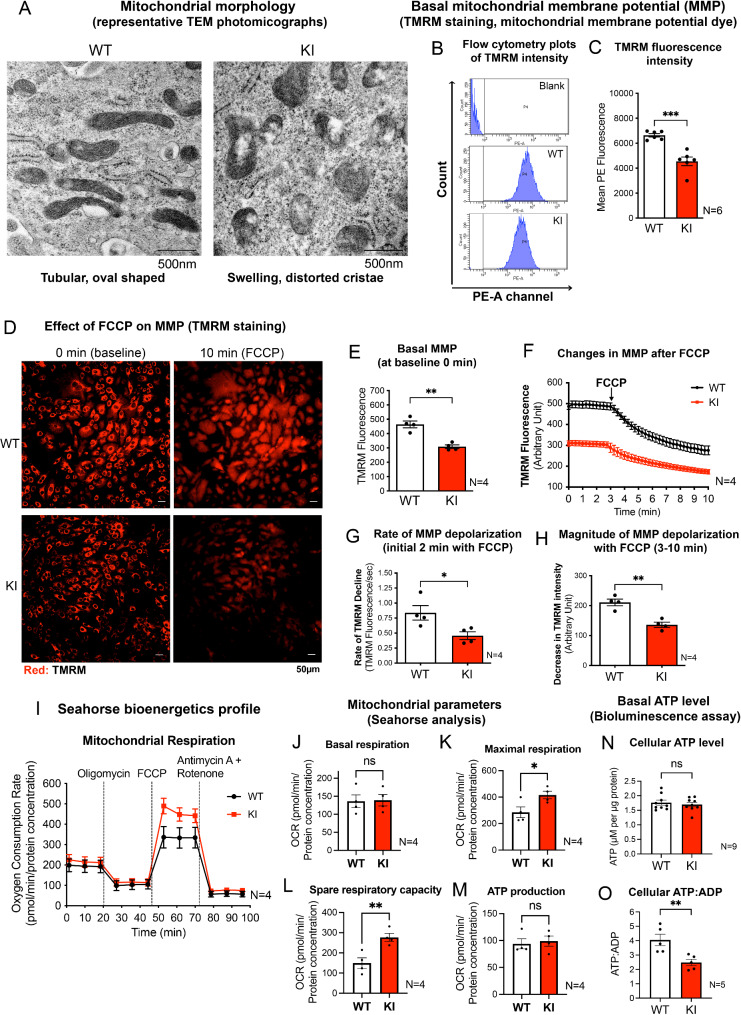
Fig. 3.
KI MEF exhibit altered unstimulated mitochondrial parameters
(A) Representative TEM photographs showing mitochondrial morphology of WT and KI MEFs under normal culture conditions. Scale bar: 500 nm. (B) Flow cytometry peaks showing mean TMRM fluorescence intensity (PE-A channel) in unstained WT (serving as blank) and TMRM-stained WT and KI MEFs. (C) Quantified mean TMRM fluorescent intensity reflecting relative basal MMP of WT and KI MEFs using flow cytometry (N = 6 experiments, 10,000 cells per N). (D) Representative fluorescent microscopic images of WT and KI MEFs stained with TMRM, a potentiometric, red fluorescent dye for mitochondrial membrane potential (MMP). Scale bar: 50 μm. (E) Quantified mean TMRM fluorescence intensity at baseline (0 min) reflecting relative basal MMP of WT and KI MEFs by microscopy (N = 4 experiments, 100 cells traced per N). (F) Real-time tracing of TMRM intensity of cells at baseline and after 3 min of FCCP (10 µM) treatment. (G) Rate of decline in absolute TMRM intensity in WT and KI MEFs as quantified by the negative slope in the first two min of FCCP treatment. (H) The magnitude of MMP depolarization in WT and KI MEFs (N = 4 experiments). (I-M) Seahorse analysis of WT and KI MEFs showing: (I) oxygen consumption rate and different mitochondrial parameters of (J) basal respiration, (K) maximal respiration, (L) spare respiratory capacity and (M) ATP production (N = 4 experiments, 10 individual wells per N). Dotted lines in (I) indicate the addition of each drug as labelled. (N) Basal cellular ATP level in WT and KI MEFs quantified using bioluminescence assay (N = 9 experiments). (O) Basal cellular ATP: ADP in WT and KI MEFs (N = 5 experiments). Data are presented as mean ± SEM. Statistical analyses by unpaired parametric Student’s t-test. *p < 0.05, **p < 0.01 and ***p < 0.001. ns, not significant

