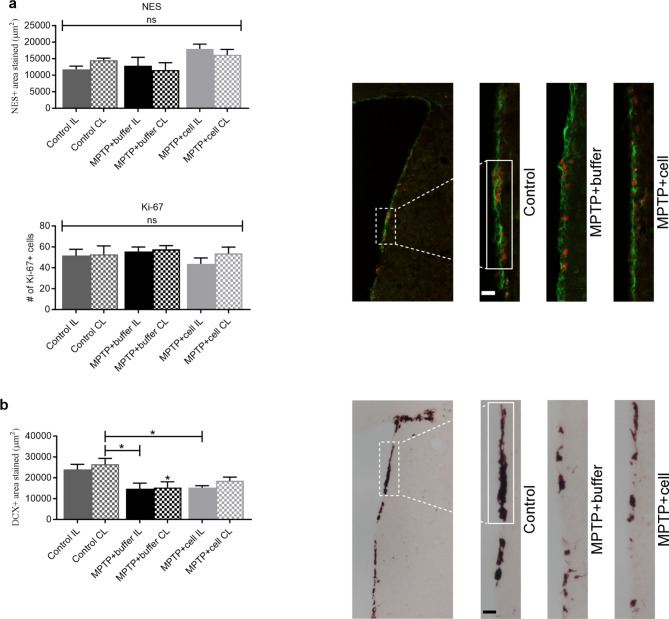
Fig. 5.
Changes in NSC and neuroblast populations in the SVZ. a Four months post-transplant, NES + area stained (green; top) and the number of Ki-67 + cells (red; bottom), were similar across all experimental groups. Control n = 3, MPTP + buffer n = 5, MPTP + cell n = 5. ns = not significant. b Expression of DCX tended to decrease in all MPTP-treated mice compared to controls; this decline was statistically significant when the CL SVZ of the control group was compared to both SVZs of buffer-treated (*P = 0.0126 for IL and *P = 0.0203 for CL) and the IL SVZ of cell-transplanted (*P = 0.0197) animals. Control n = 7, MPTP + buffer n = 9, MPTP + cell n = 9. * = compared to same brain hemisphere of Control. a, b One-way ANOVA followed by Tukey´s post-hoc test. Scale bars = 25 μm. IL = ipsilateral, CL = contralateral, NSC = neural stem cell, SVZ = subventricular zone

