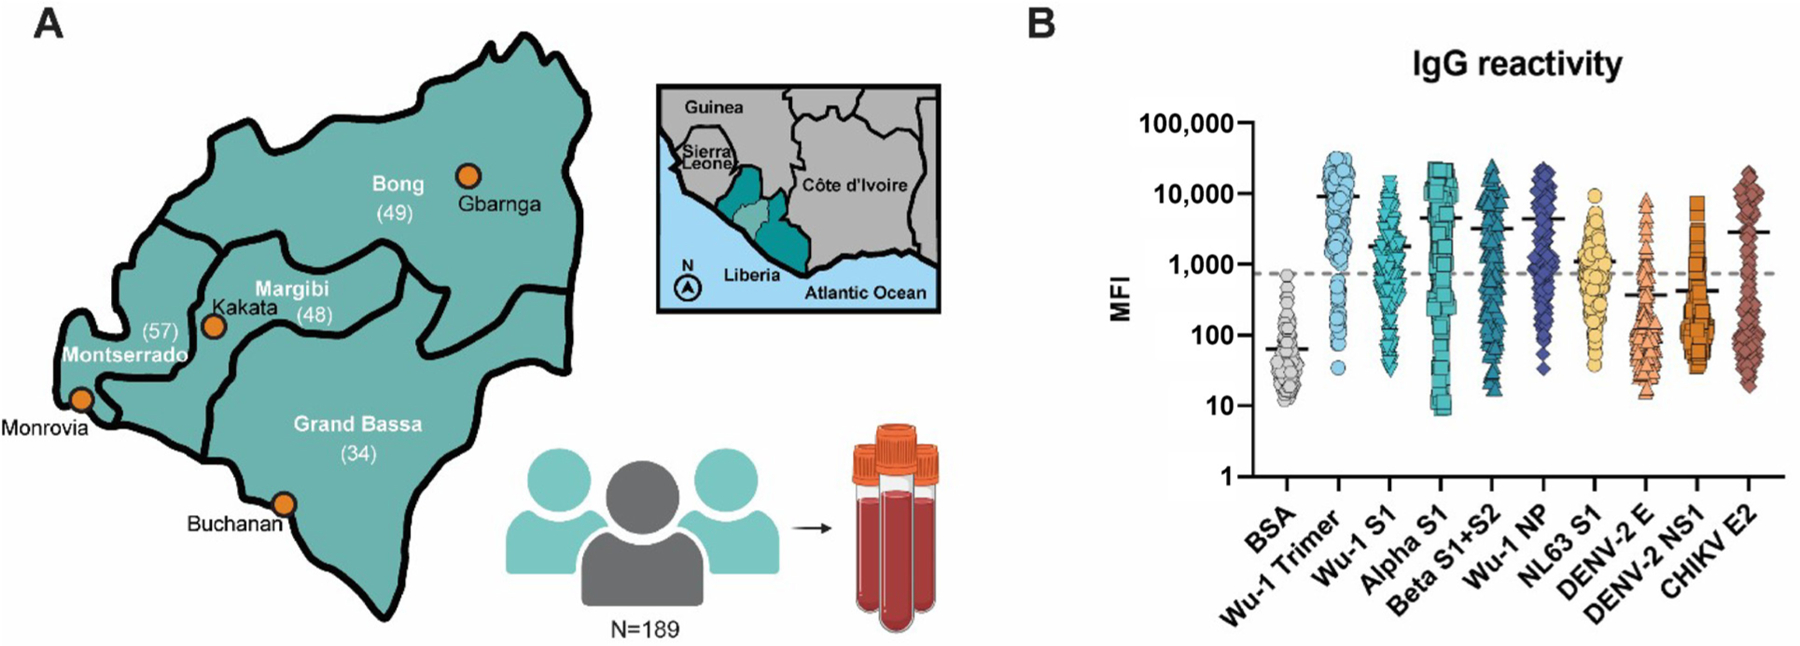
Figure 2.

Liberian sera display broad viral antibody reactivity. (A) Graphical map indicating locations of the four counties and (n) of the previously collected samples. The four counties are located in central Liberia as indicated by the light green inset. Graphics created with BioRender.com and Adobe Illustrator. (B) MIA of overall IgG reactivity. The grey line indicates the cut-off value for the BSA background (mean MFI plus three times the standard deviation).
