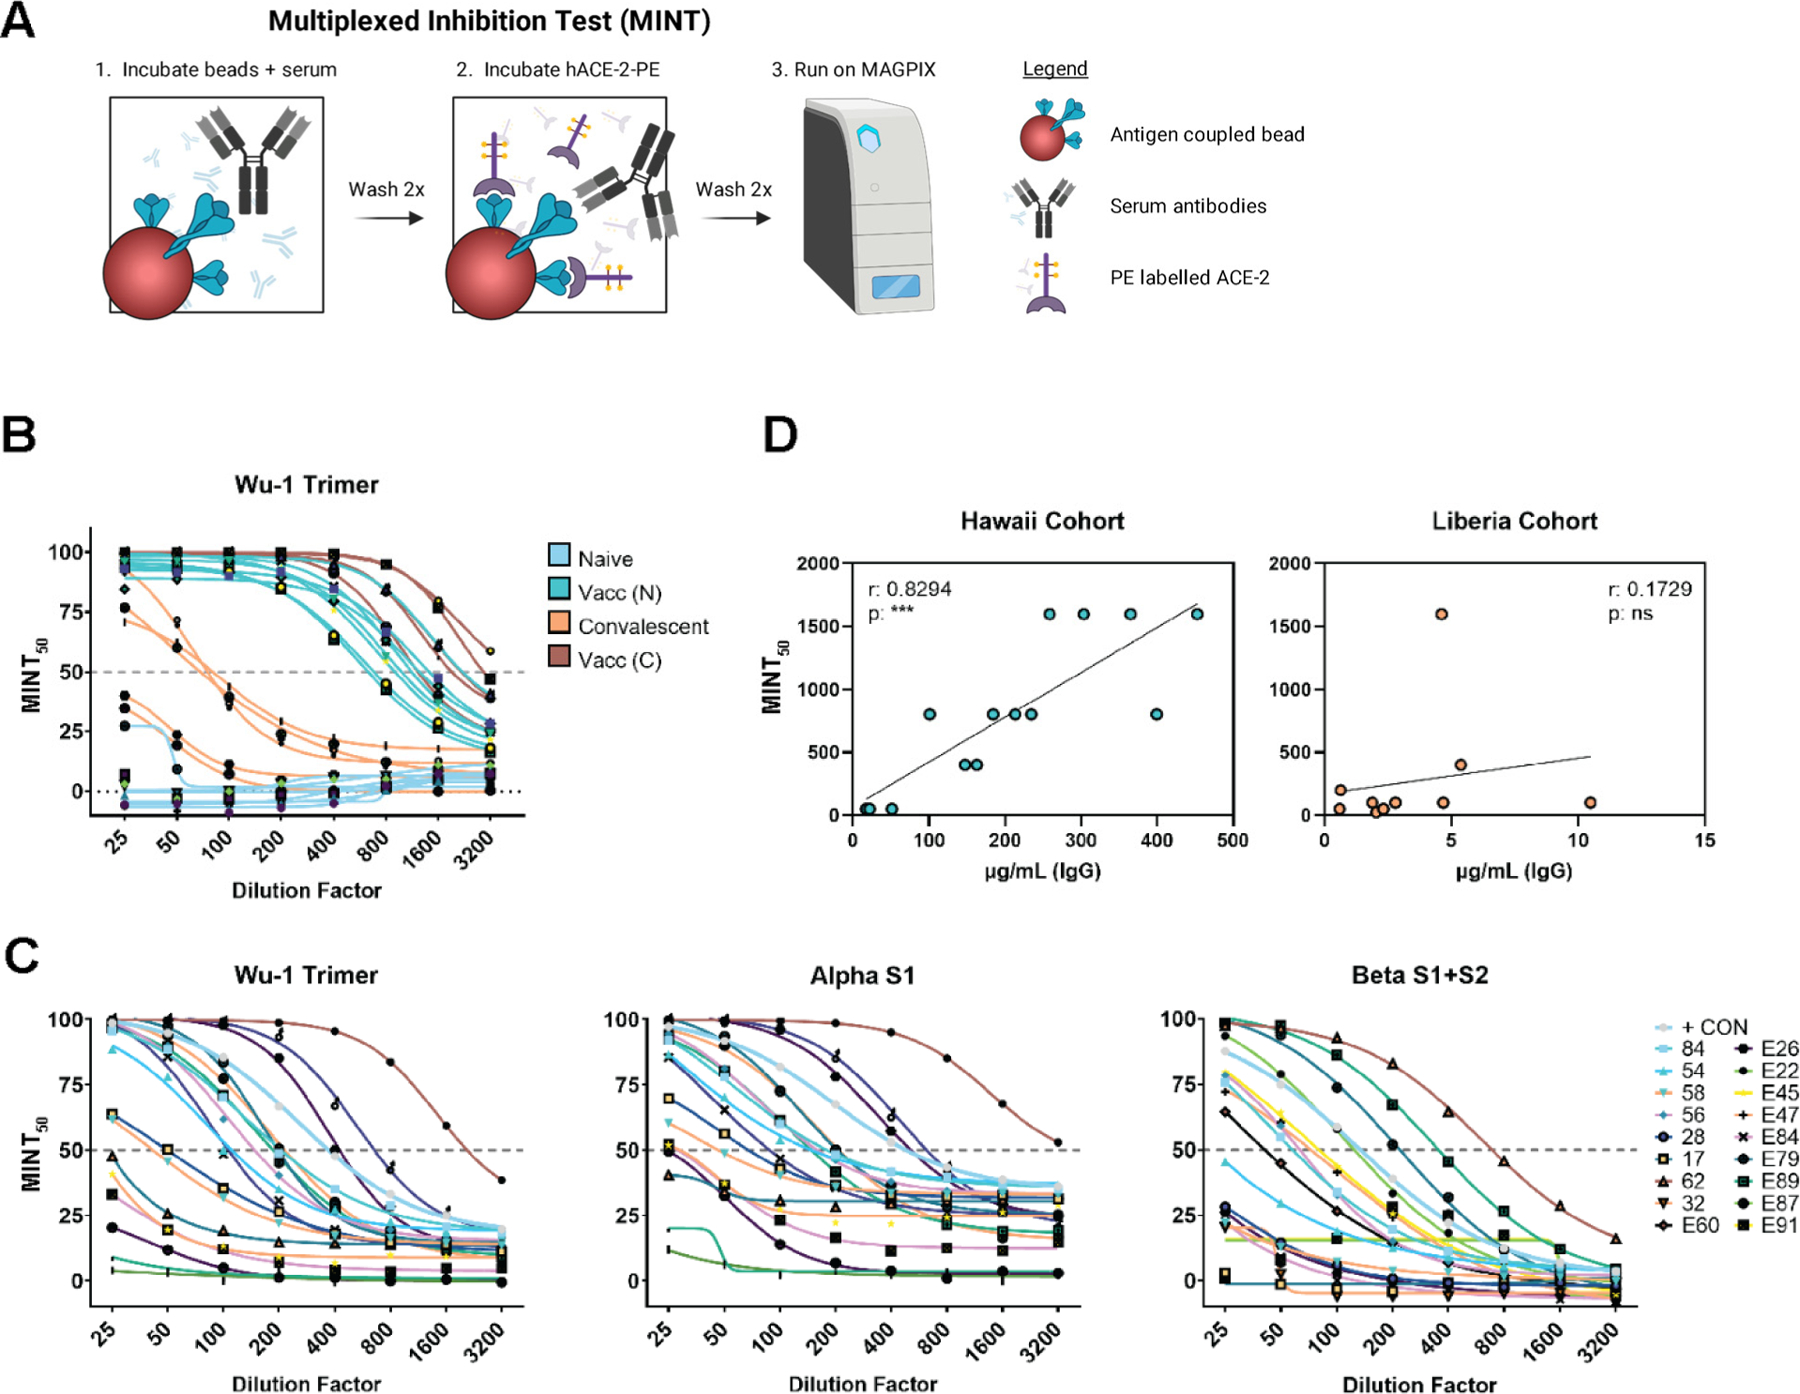
Figure 5.

The multiplexed inhibition test (MINT) reveals antibody functionality. (A) Graphical representation of the MINT assay created with BioRender.com and Adobe Illustrator. (B) MINT curves from Hawaii samples were performed on baseline and post-dose 2 samples for the Wuhan Hu-1 trimer antigen. (C) MINT curves for Liberia samples were performed on Wuhan Hu-1 trimer, Alpha-S1, and Beta-S1 + S2 antigens. (D) Correlations of MINT50 values and interpolated IgG concentrations for samples collected in Hawaii or Liberia. Pearson r and p values were calculated using GraphPad Prism. ***< 0.001.
