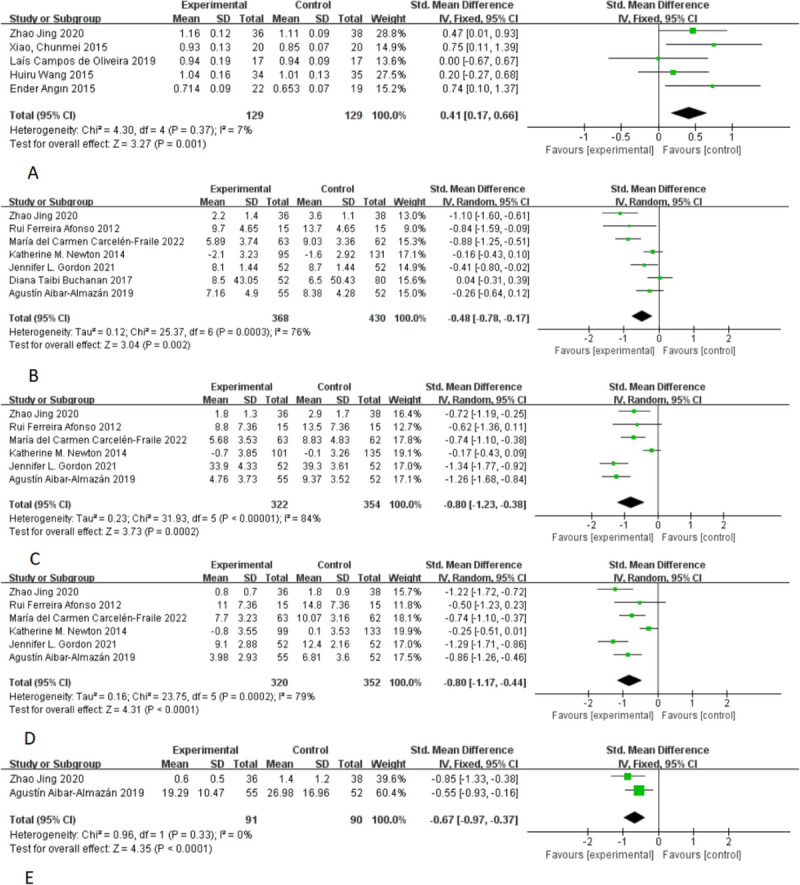
FIG. 3.

Forest plots show individual and combined effect size estimates and 95% CI for studies on the effects of mind-body exercise interventions. Horizontal lines represent 95% CI, boxes represent study-specific weights, and diamonds represent combined effect sizes. (A) bone mineral density; (B) sleep quality; (C) anxiety; (D) depression; (E) fatigue.
