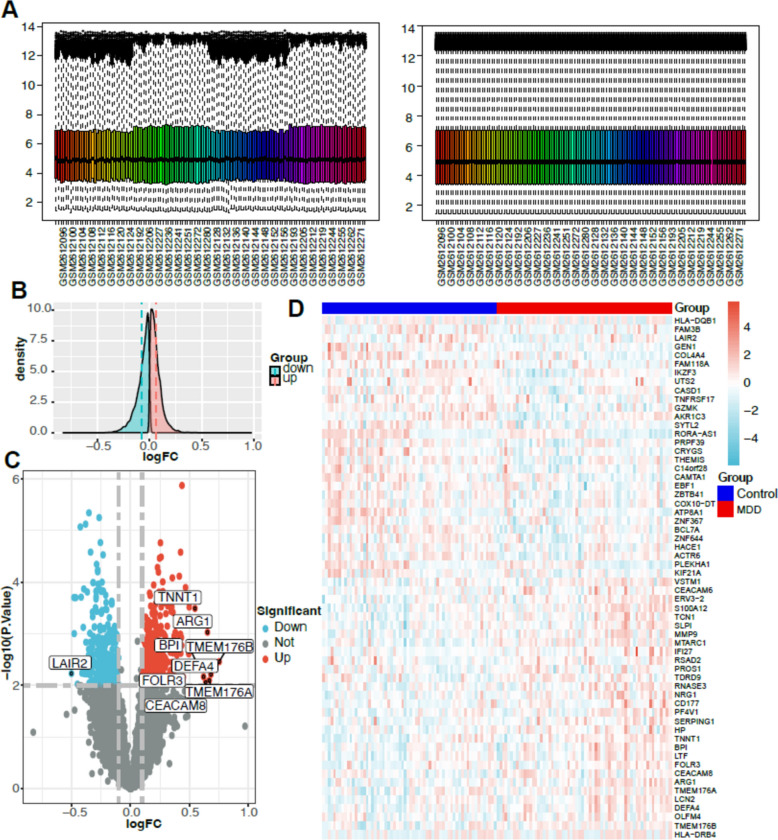
Fig. 2.
Identification of DEG in peripheral blood of patients with MDD. A Normalization process. B Sample expression density plot, pink indicates depression up-regulated gene expression and cyan indicates depression down-regulated gene expression. Where the dashed lines represent the mean of each of the two groups. C Volcano plot showing differential genes in MDD, red is for significantly up-regulated genes and blue is for significantly down-regulated genes. D Heat map showing the expression of the top 30 differential genes in the sample

