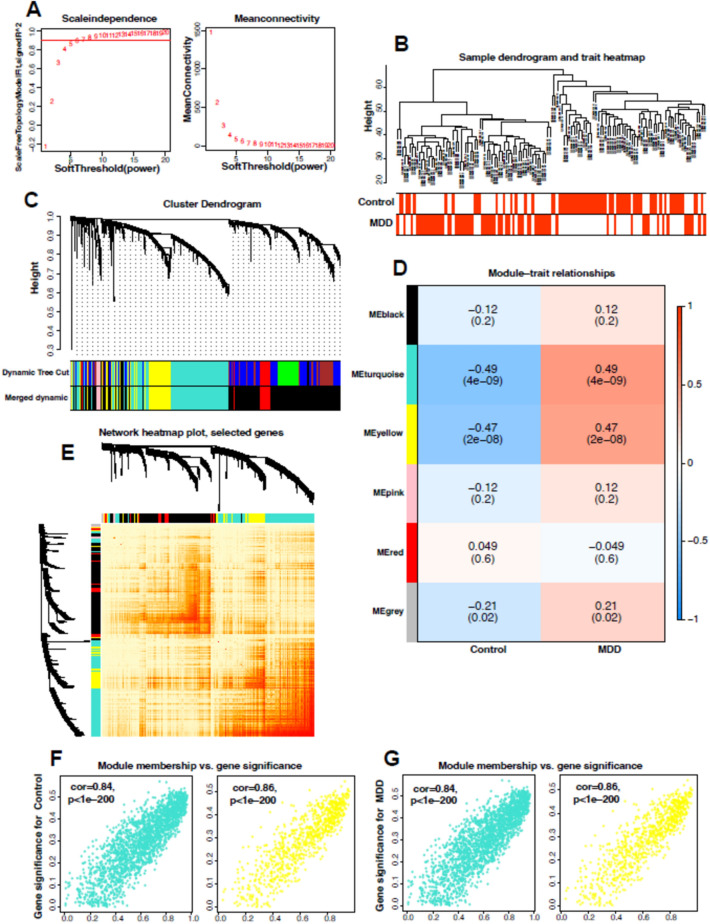
Fig. 3.
Construction of the weighted gene co-expression network for MDD. A Soft threshold β = 5 and scale-free topological fit index (R2). B Sample clustering dendrograms with leaves corresponding to each sample. C Original and combined modules at a dynamic cut height of 0.2. D Heat map of module-trait correlations. 5 rows correspond to each of the 5 combined modules, 2 columns correspond to the normal and MDD groups, and the cells contain the corresponding correlation coefficients and P values. E Cluster dendrogram of the module trait genes. F MM-GS scatter plots of peacock green and yellow modules in the control group. G Scatterplot of peacock green module and blue module MM-GS of MDD group

