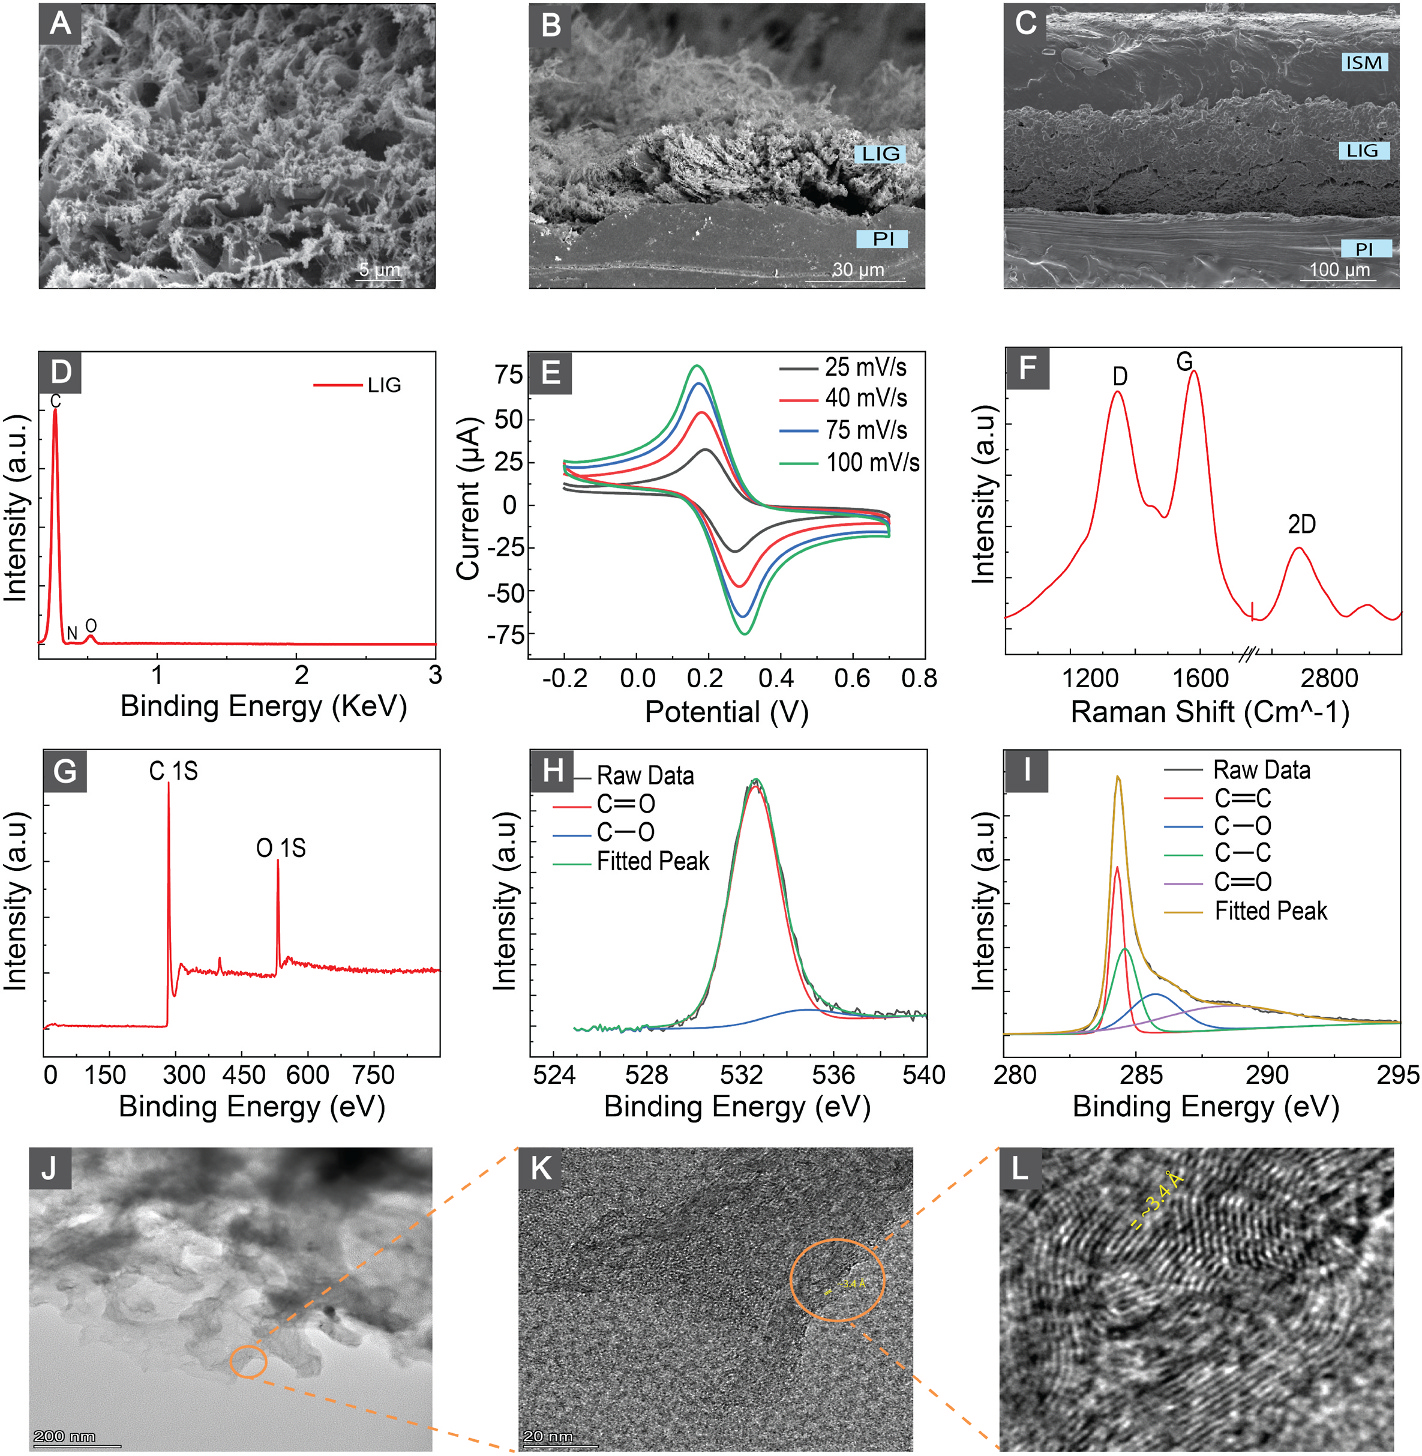
Fig. 2.

(A) Top-view SEM images of LIGs. (B) Cross-section SEM of LIGs. (C) Cross-section SEM of ISM on top of LIG. (D) EDX results and analysis of the LIG. (E) Cyclic voltammograms of the LIG electrodes at scan rates from 25 to 100 mV/s in 2 mM solution of [Fe(CN)6]3−/4−. (F) Raman spectrum of LIGs. (G) XPS survey on the surface of the LIGs. (H,I) XPS spectra for O 1s and C 1s respectively. (J) TEM image of LIG flakes. (K,L) High Resultion TEM (HRTEM) image of LIGs shows an average d-spacing of ≈ 3.4 Å that corresponds to the (002) planes of graphitic materials.
