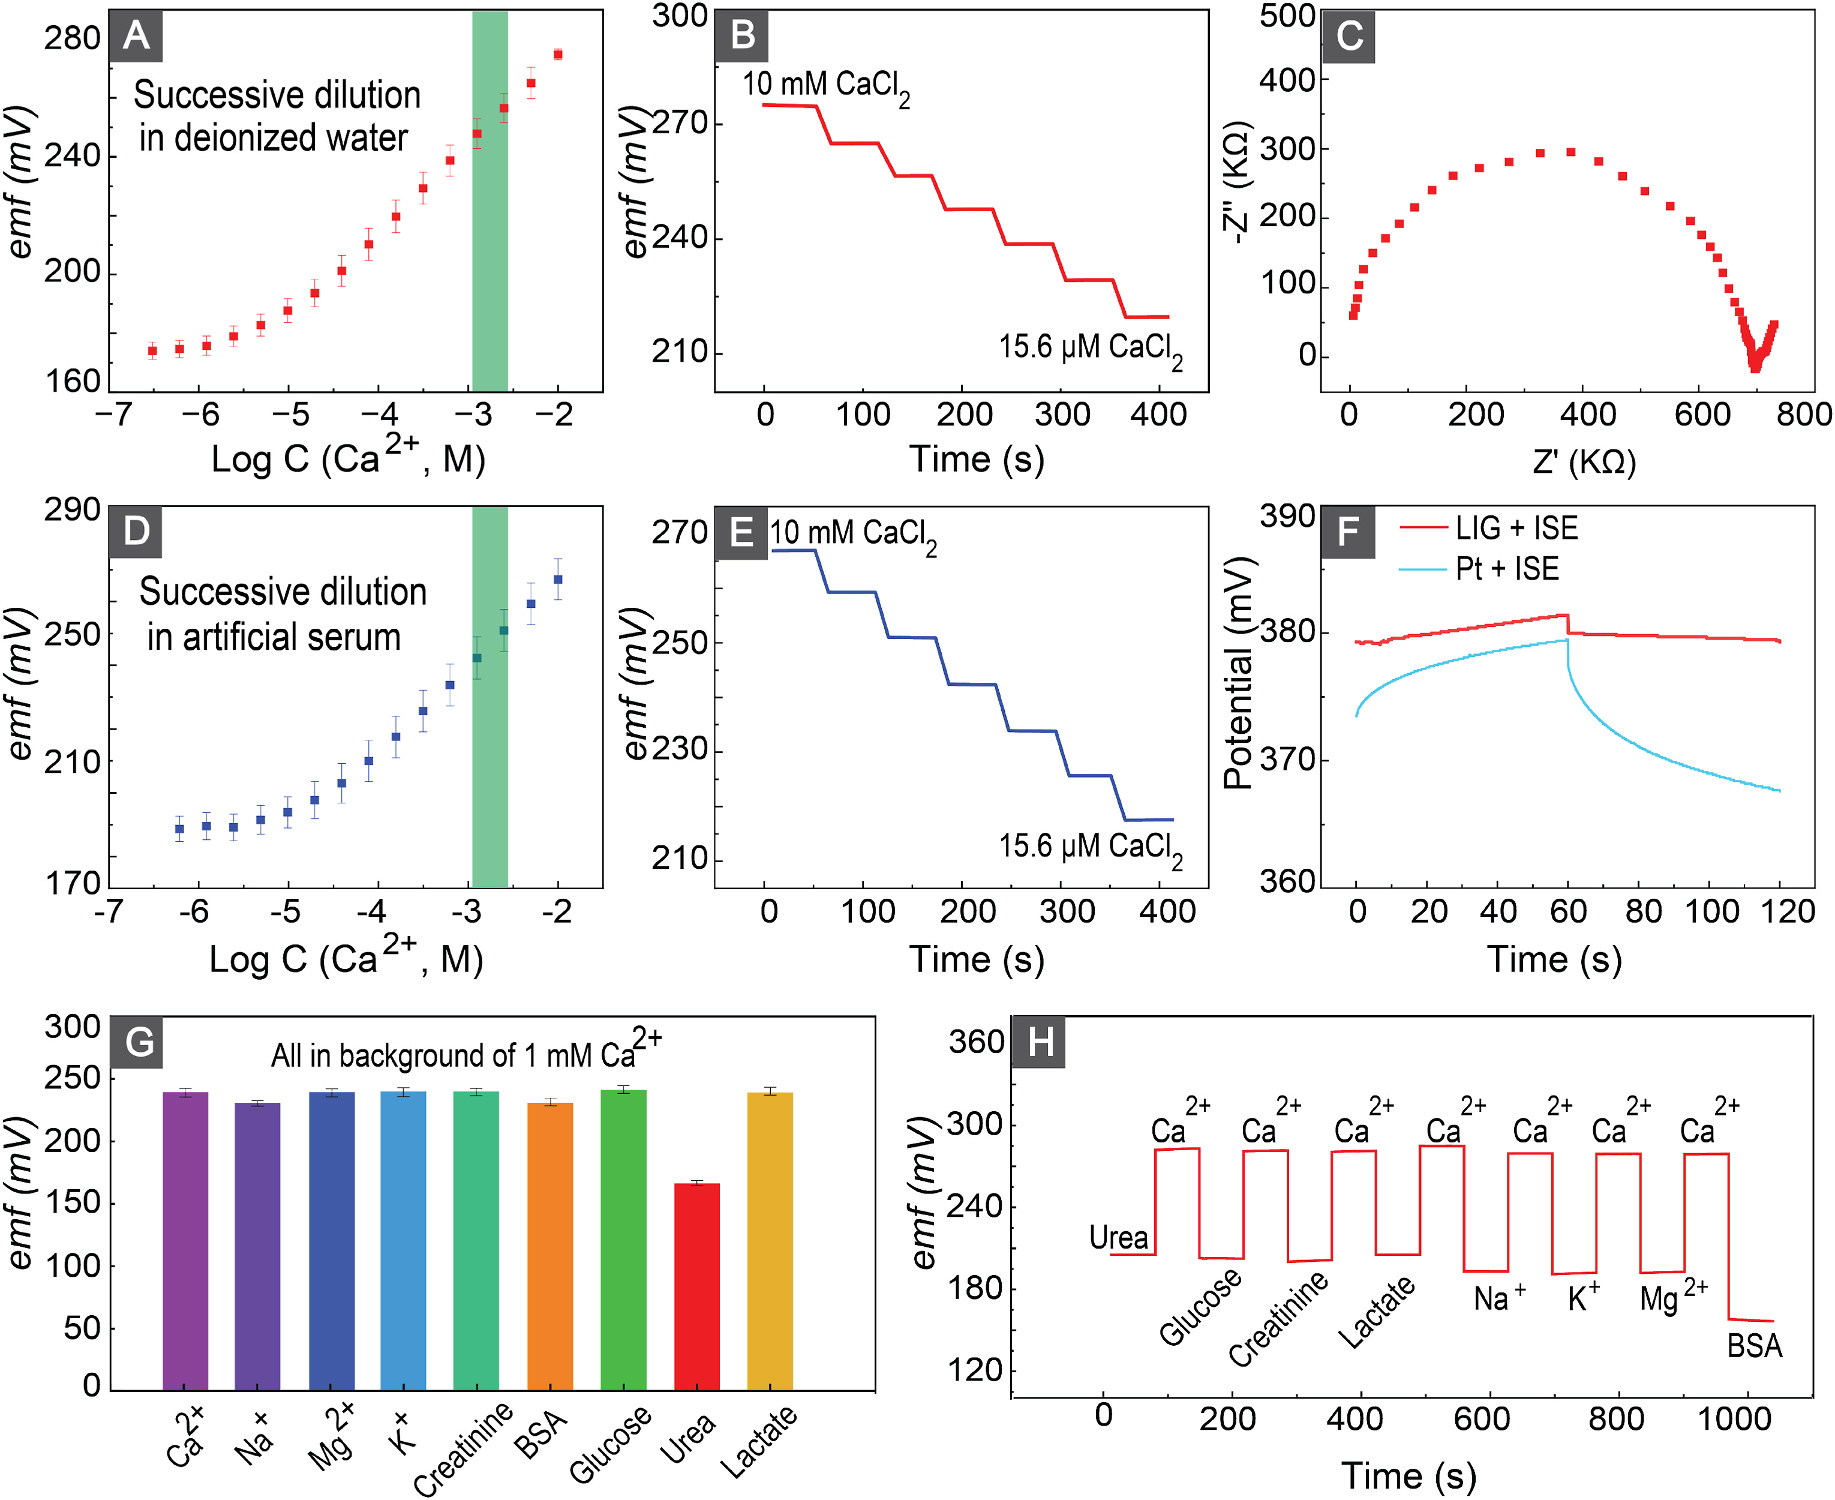
Fig. 3.

(A,D) Calibration curves of the calcium sensor in deionized water and artificial serum. Green shows the physiological relevant Ca2+ concentration in milk fever (B,E) Emf trace of the calcium sensor after successive half dilution process in deionized water and artificial serum. (C) EIS result of the sensor in 10 mM calcium chloride. (F) Chronopotentiometry results of a calcium membrane-coated Pt wire and calcium membrane-coated LIG to ± 1 nA perturbation current. (G) Response of a representative calcium sensor to different physiologically relevant ions and biologicals in the background of 1 mM CaCl2. (H) Response and reversibility of the sensor after successive insertion of the sensor into CaCl2 and different biologicals and ions.
