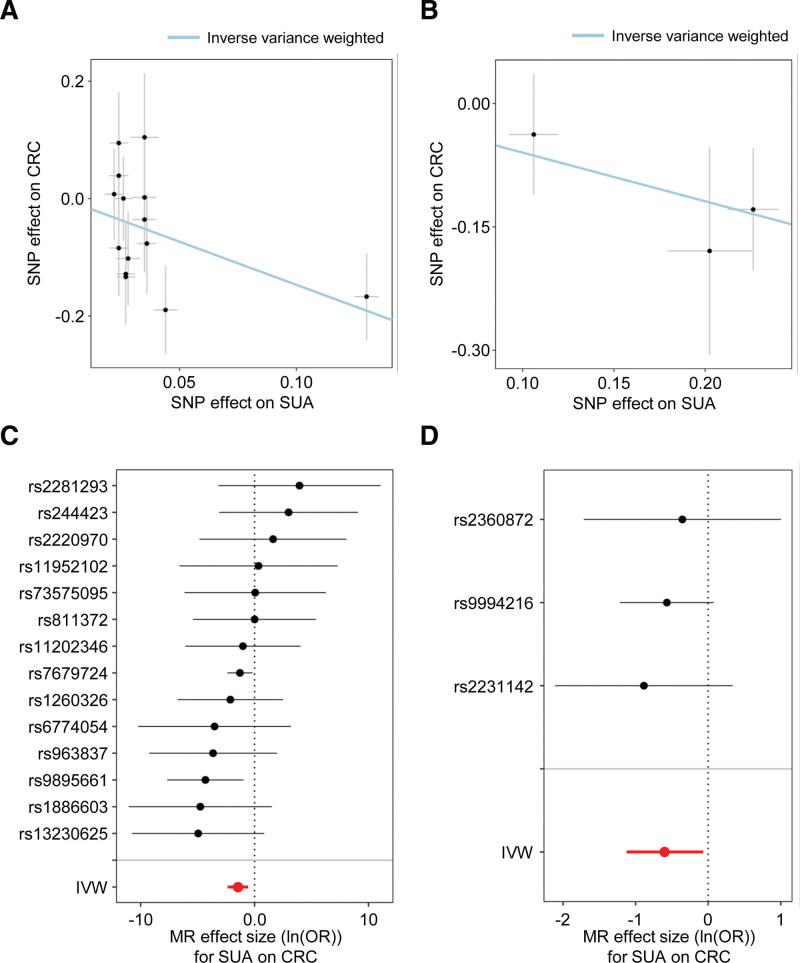
Figure 2.
MR using the IVW method demonstrates negative associations between SUA levels and CRC. The correlations of genetic instruments for SUA (depicted as the effect size on the X axis) with CRC (represented on the Y axis) were charted based on the GWAS summary data in two MR analyses: (A) the causal relationship of the first MR analysis (setting GCST007725 as exposure and ukb-e-208_CSA as the outcome), and (B) the causal relationship of the second MR analysis (setting ukb-e-30880_CSA as exposure and ukb-e-208_CSA as the outcome). The gradient of the blue line indicates the MR estimation of the causal effect, using the IVW method. Each black dot indicates the causal effect size of each SNP, acting as genetic IVs, determined through the Wald ratio test in the first MR analysis (C) and second MR analysis (D). The red dot represents the effect size for the causality of the amalgamated SNPs, utilizing the IVW method. Error bars illustrate 95% CIs. CI = confidence interval, CRC = colorectal cancer, GWAS = genome-wide association study, IV = instrumental variable, IVW = inverse variance-weighted, MR = Mendelian randomization, SNP = single nucleotide polymorphism, SUA = serum uric acid.

