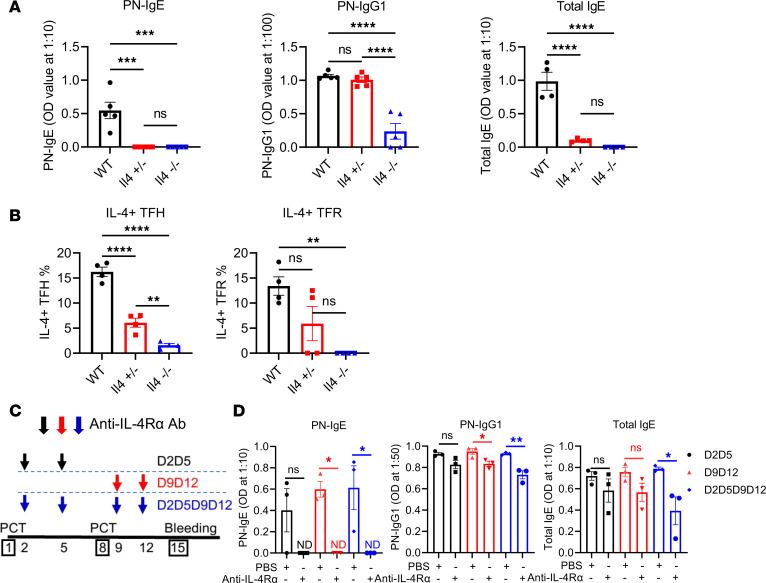
Figure 6. Antigen-specific IgE and IgG1 are differentially affected by IL-4 levels.
(A) PN-specific IgE, PN-specific IgG1, and total IgE in WT, Il4+/–, and Il4–/– mice after PCT. Mice were sensitized with PCT at day 1 and day 8. Sera were collected at day 15, and Abs were tested using ELISA. n = 4. (B) IL-4+ TFH and TFR cells in WT, Il4+/–, and Il4–/– mice. IL-4–expressing cells were measured by flow cytometry after PCT sensitizations at day 1 and day 8. n = 4. (C) Set-up of IL-4Rα blocking assay. Mice were injected with anti–IL-4Rα Ab as indicated in the diagram. Mice were sensitized with PCT at day 1 and day 8. Sera were collected at day 15, and Abs were tested using ELISA. (D) PN-specific IgE, PN-specific IgG1, and total IgE with IL-4Rα blocking after PCT. n = 3. *P < 0.05, **P < 0.01 by t test (A) or 1-way ANOVA (B–D). Data were representative of 1 (C and D) or 2 independent experiments (A and B).

