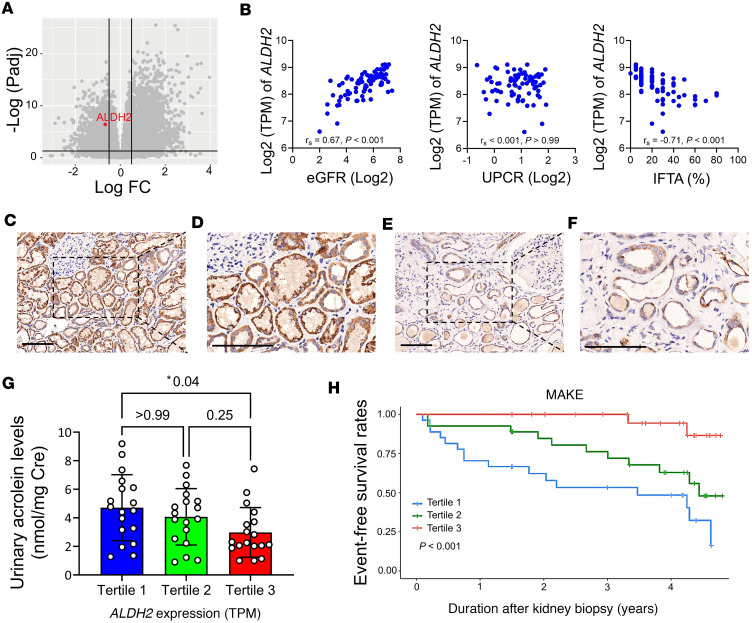
Figure 1. The diminished expression of ALDH2 in kidney tissues is correlated with adverse kidney outcomes in individuals with CKD.
(A) The volcano plot illustrates gene expression changes, indicating ALDH2 downregulation in fibrotic kidney disease compared with nonfibrotic cases. The x axis represents log2 fold-change, and the y axis represents –log10 (P values). (B) Scatterplots depict the correlation between kidney ALDH2 mRNA levels and estimated glomerular filtration rate (eGFR, the left panel), proteinuria (the middle panel), and the extent of interstitial fibrosis and tubular atrophy (IFTA, the right panel). Correlation coefficients (rs) and P values are displayed. (C–F) Immunohistochemical staining of kidney biopsies from CKD versus healthy controls showed strong ALDH2 positivity in normal tubular epithelia (C), contrasting with reduced expression in advanced CKD (E). Enlarged views are displayed on the right (D and F). (Original magnifications of ×200 in C and E and ×400 in D and F.) Scale bar: 100 μm. (G) Urinary acrolein levels in CKD were assessed based on kidney ALDH2 mRNA tertiles. Acrolein levels increased with declining ALDH2 expression, with tertiles at 238.3 (197.7–273.2), 352.8 (333.3–374.6), and 427.8 (408.5–486.2) transcripts per million (TPM). (H) Major adverse kidney events (MAKEs), stratified by kidney ALDH2 tertiles, showed a significant association in Kaplan-Meier survival curves, determined by the log-rank test. An MAKE was defined as a greater than 40% decline in eGFR, kidney failure, or death. ALDH2, aldehyde dehydrogenase 2; CKD, chronic kidney disease; UPCR, urine protein creatinine ratio.

