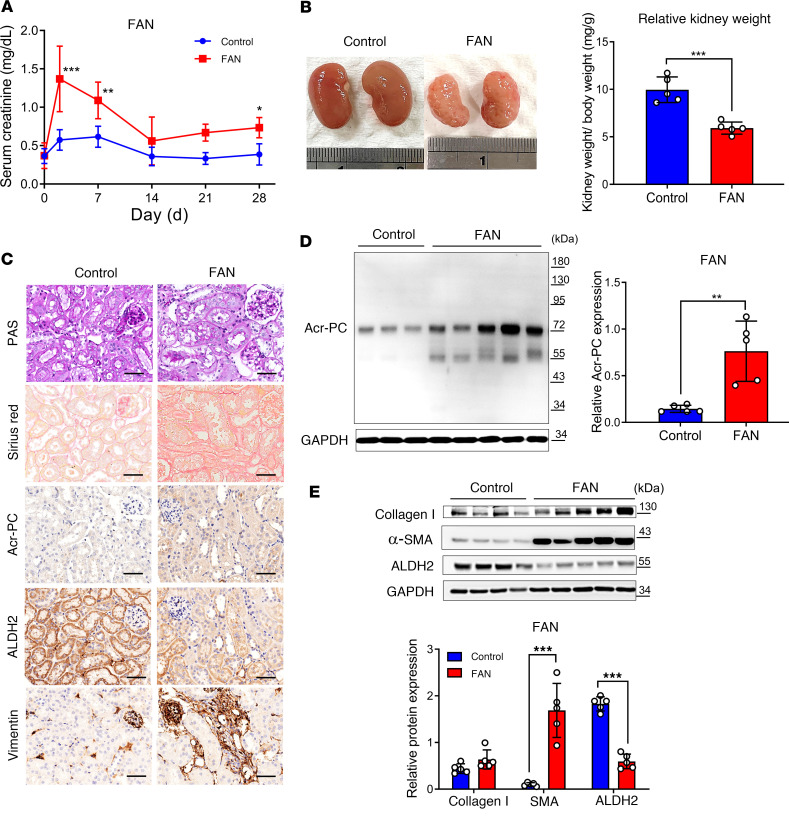
Figure 3. Assessment of Acr-PCs, ALDH2 expression, and fibrosis markers in Aldh2*1 mice after FAN.
WT mice (n = 5) received intraperitoneal injections of folic acid (FA) (225 mg/kg in 300 mM NaHCO3) and were subsequently sacrificed on day 28. (A) Measurement of serum creatinine (sCr) of mice on day 0, 3, 7, 14, 21, and 28 after FA injection. (B) Representative kidney gross appearance is displayed in the left panel, and the right panel presents a statistical analysis of the kidney-to-body weight ratio. (C) Periodic acid–Schiff (PAS) staining is shown in the first panel to assess morphological changes in kidney tissues. Sirius red staining to evaluate the kidney fibrosis area on day 28 after FA injection is depicted in the second panel. Immunohistochemistry for Acr-PCs, ALDH2, and Vimentin in kidney tissues is presented in the third through fifth panels. Scale bar: 50 μm. (D) The left panel shows Western blot analysis of Acr-PCs in kidney tissues of mice on day 28 after FA injection, with quantification of these proteins presented in the right panel. (E) The upper panel shows Western blot analysis of collagen 1, α–smooth muscle actin (α-SMA), and ALDH2 in kidney tissues of mice on day 28 after FA injection, with quantification of these proteins presented in the lower panel. Data are represented as mean ± SD. Statistical significance was determined using Mann-Whitney U tests, and 2-tailed P values are shown. *P < 0.05, **P < 0.01, ***P < 0.001 compared with the vehicle control group. Acr-PCs, acrolein-protein conjugates; ALDH2, aldehyde dehydrogenase 2; WT, wild-type; FAN, folic acid nephropathy.

