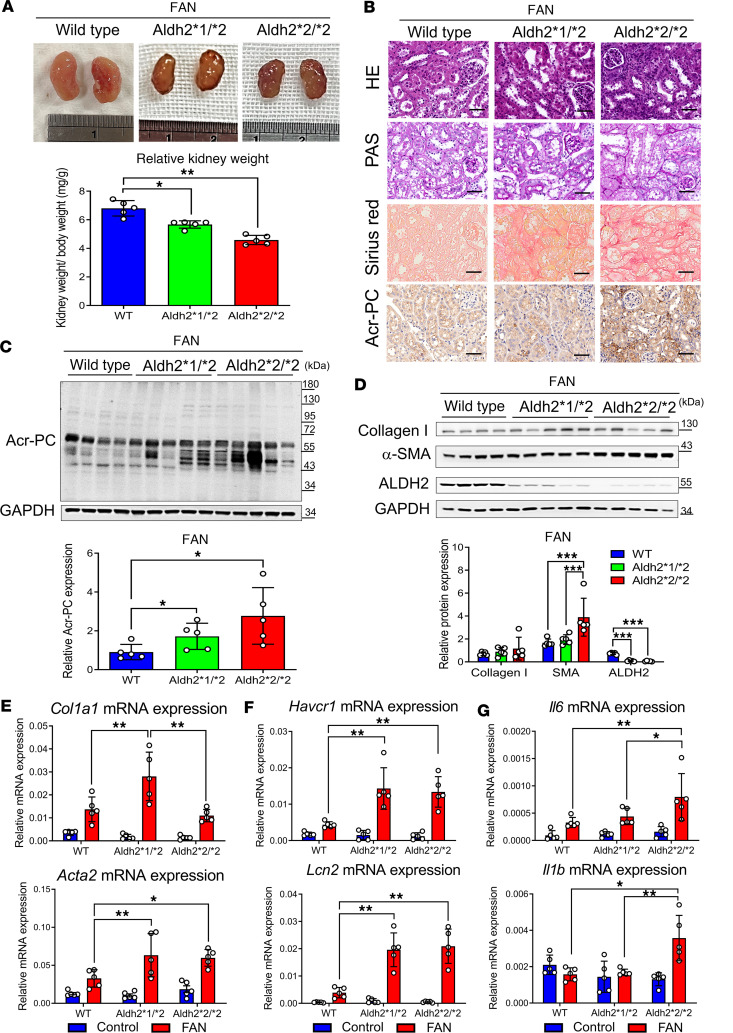
Figure 5. Assessment of Acr-PCs, fibrosis markers, inflammatory cytokines, and kidney damage markers in Aldh2*1/*2 and Aldh2*2/*2 mice compared with Aldh2*1 mice after FAN.
WT, Aldh2*1/*2, and Aldh2*2/*2 mice (n = 5 for each group) were intraperitoneally administered folic acid (FA) (225 mg/kg in 300 mM NaHCO3) and sacrificed on day 28. (A) The upper panel displays the gross appearance of representative kidneys, while the lower panel presents the statistical analysis of the kidney-to-body weight ratio. (B) H&E and periodic acid–Schiff (PAS) staining are shown in the first and second panels to assess morphological changes in kidney tissues. Sirius red staining to evaluate the kidney fibrosis area on day 28 after FA injection is depicted in the third panel. Immunohistochemistry for Acr-PC in kidney tissues is presented in the fourth panel. Scale bar: 50 μm. The upper panel displays Western blot analysis of (C) Acr-PCs, (D) collagen 1, α–smooth muscle actin (α-SMA), and ALDH2 in kidney tissues of mice, with quantification of these proteins shown in the lower panel. mRNA expression of (E) Col1a1, Acta2, (F) Havcr1, Lcn2, and (G) Il6 and Il1b in kidney tissues of mice was assessed using quantitative reverse transcription PCR analysis. Data are presented as mean ± SD. Statistical significance was determined using Kruskal-Wallis tests, and 2-tailed P values are shown. *P < 0.05, **P < 0.01, ***P < 0.001 compared with the WT group. Acr-PCs, acrolein-protein conjugates; ALDH2, aldehyde dehydrogenase 2; WT, wild-type; FAN, folic acid nephropathy; Acta2, actin alpha 2; Aldh2, aldehyde dehydrogenase 2; Col1a1, collagen type I alpha 1 chain; Havcr1, hepatitis A virus cellular receptor 1 homolog; Il6, interleukin-6, Il1b, interleukin-1β; Lcn2, lipocalin-2.

