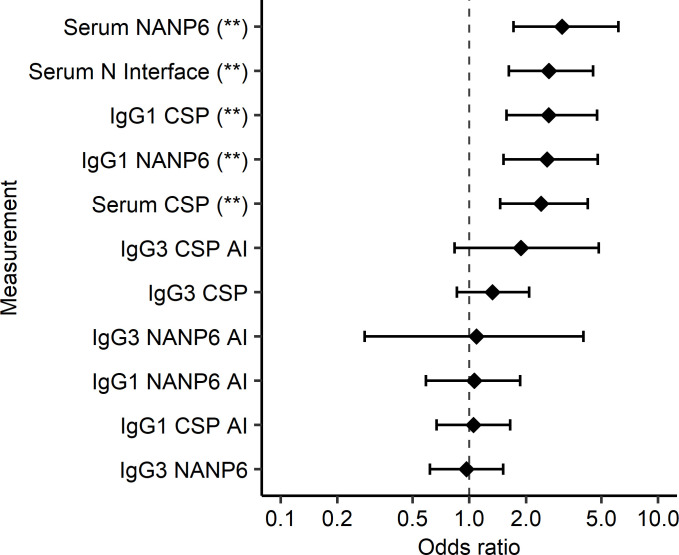
Figure 3. Serum Ig, IgG1 CSP, and NANP6 measurements associate with protection status in MAL092.
Odds ratio estimates (circles) and 95% CIs (error bars) obtained from regimen-adjusted logistic regression models fit independently to each immune measurement (Protection ~ Regimen + immune measurement) based on MAL092 DoC data are shown. Asterisks represent statistically significant associations based on FDR-adjusted (Benjamini-Hochberg) P values: *P < 0.05, **P < 0.01.

