
Figure 1 |. Kaplan-Meier analysis of death-censored graft survival in patients with chronicity index (CI) <4 (n = 82) versus CI ≥4 (n = 65) in the Cedars-Sinai cohort.
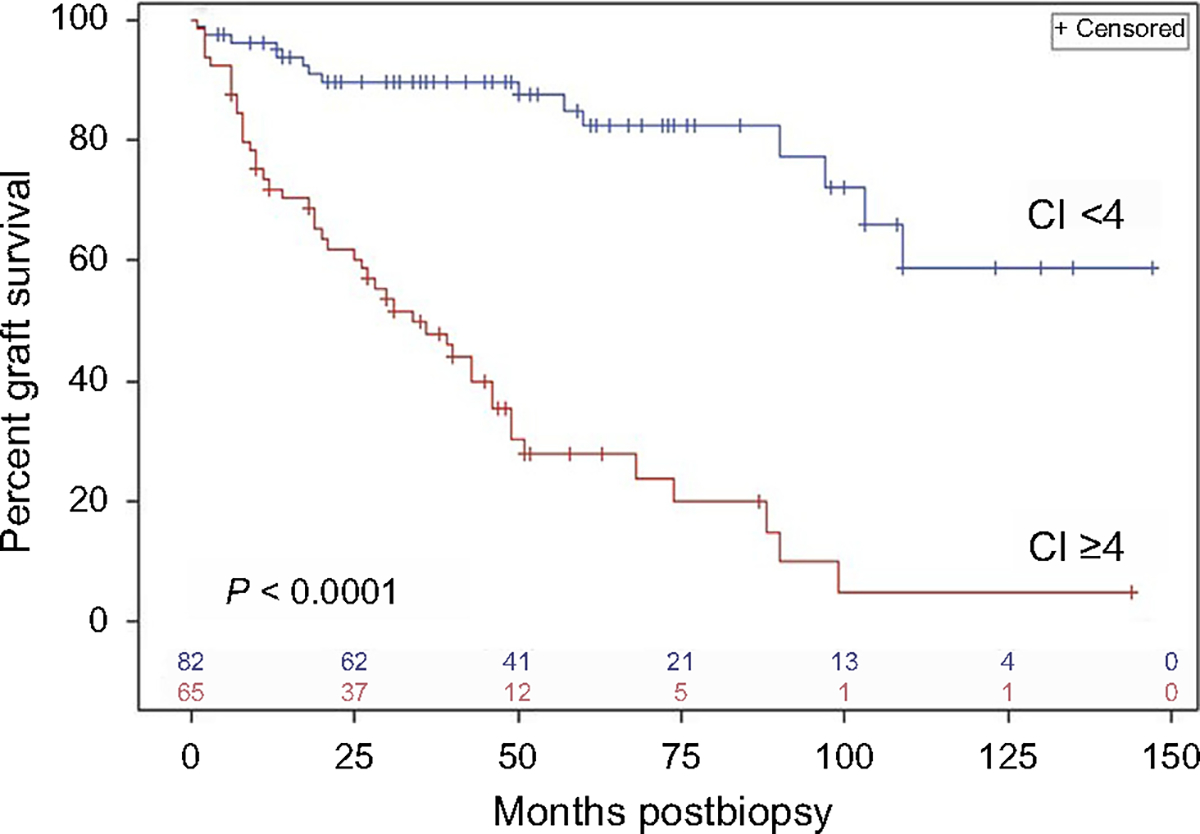
Vertical ticks on each curve indicate censored values (time post-transplantation of last follow-up without graft loss), and the numbers of remaining uncensored cases are indicated just above the x-axis. The 2 curves are significantly different (P = 0.0001) by log-rank analysis.