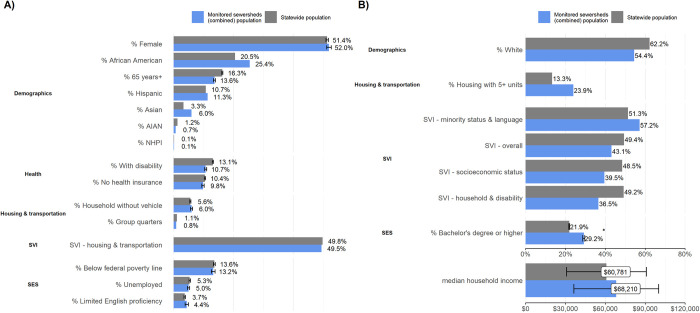
Fig 1. Demographic differences between monitored sewersheds and the statewide population.
Plots show A) variables with less than a 5% or pp difference and B) variables with greater than a 5% or pp difference. The error bars represent the 95% confidence interval which was only calculated for variables in the ACS 2015–2019 data because the MOE information wasn’t available for the 2020 census at the time of the analysis. Variables with a statistically significant difference are indicated by an asterisk (*).

