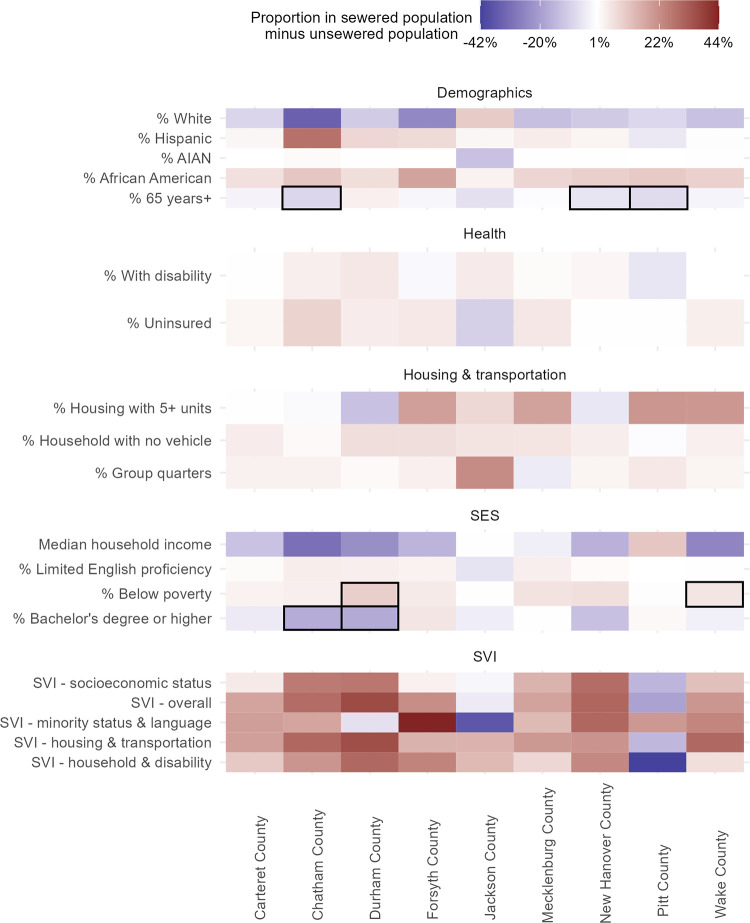
Fig 4. Demographic differences between sewered and unsewered county residents.
Only demographic variables with more than a +/-5% or pp difference (sewered–unsewered) are shown. Counties are displayed from west to east based on the location of the county centroids. Shades of red indicate the variable is higher in the sewered population while shades of blue indicate the variable is higher in the unsewered population. Blocks highlighted with a black outline are both meaningfully different and statistically significantly different.

