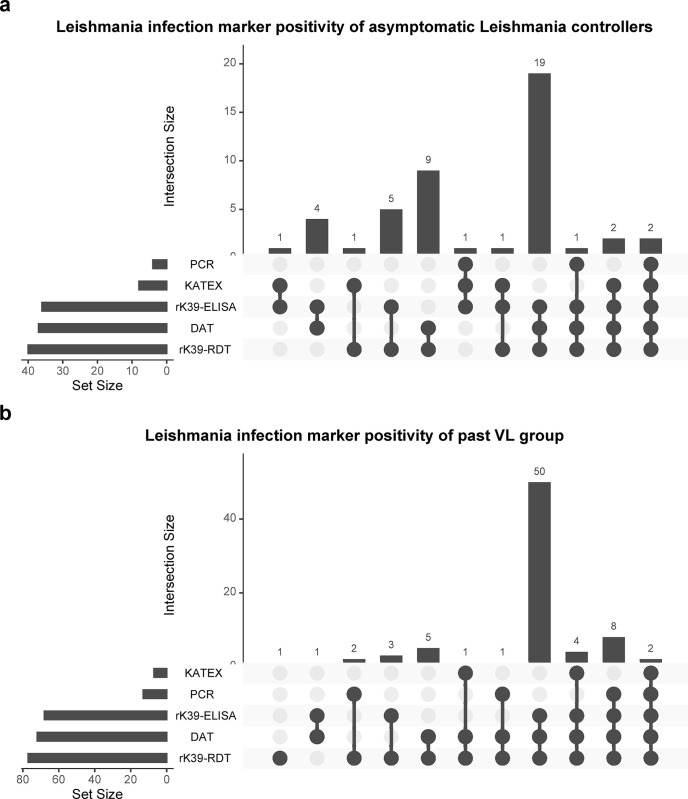
Fig 2.
Upset plot showing positivity on the Leishmania infection markers (rK39 RDT, rK39 ELISA, DAT, KAtex, and Leishmania PCR) for A) the asymptomatic Leishmania controllers (n = 46) and B) the past VL group (n = 78). Positivity in this graph means positivity at any study timepoint. The set size is the number of participants positive for any of the Leishmania infection markers, and the intersection size is the number of participants co-positive for a particular combination of Leishmania infection markers.

