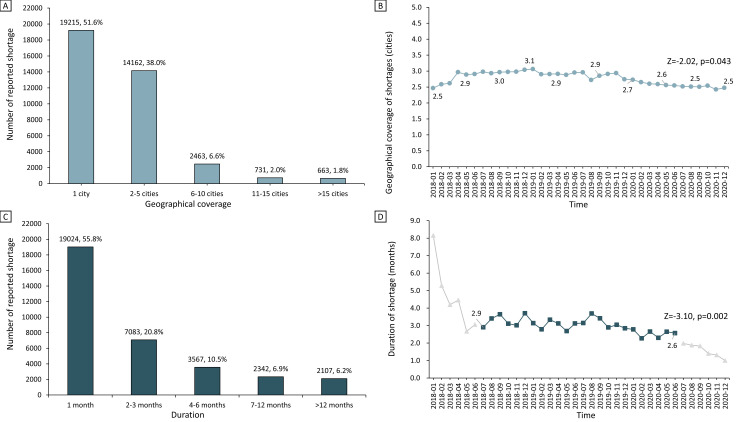
Figure 2.
Distribution of and trends in geographical coverage and duration of reported shortages from 2018 to 2020: Panel A. Number of reported shortages for different levels of geographical coverage. Panel B. Monthly trends in the average geographical coverage of reported shortages. Panel C. Number of reported shortages for different durations. Panel D. Monthly trends in the average duration of reported shortages. To avoid possible bias stemming from the possibility that shortages starting earlier would expect longer duration, trend tests for the duration of shortages were performed after excluding data from the first and last six months (almost one standard deviation of average shortage duration) of the study period.

