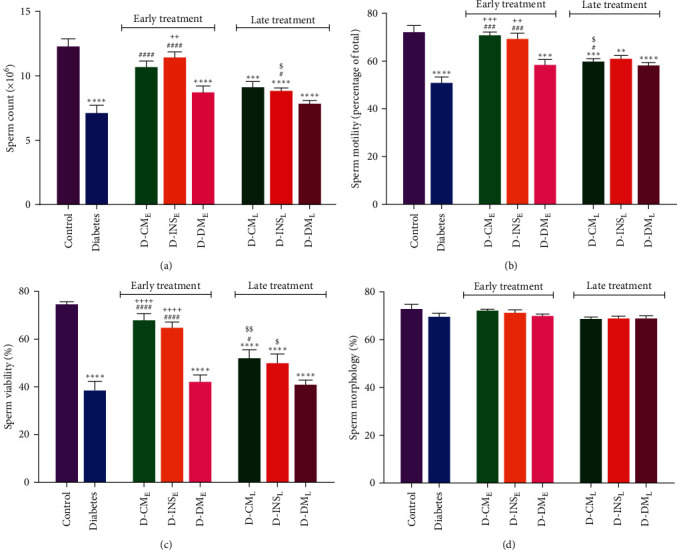
Figure 5.

Count (a), motility (b), viability (c), and morphology (d) of sperm in the control, diabetes, early and late insulin, CM, and DMEM-treated diabetic groups. Data were analyzed by one-way ANOVA (Tukey's HSD test) and presented as mean ± SEM (n = 7). ∗ ∗P < 0.01, ∗ ∗ ∗P < 0.001, ∗ ∗ ∗ ∗P < 0.0001 vs. the control group; #P < 0.05, ###P < 0.001, ####P < 0.0001 vs. diabetic group; $P < 0.05, $$P < 0.01 vs. the early-treated diabetic group; and ++P < 0.01, +++P < 0.001, ++++P < 0.0001 vs. the D-DME group. D-CME, diabetic group receiving early WJMSCs-CM; D-CML, diabetic group receiving late WJMSCs-CM; D-INSE, diabetic group receiving early insulin; D-INSL, diabetic group receiving late insulin; D-DME, diabetic group receiving early DMEM; D-DML, diabetic group receiving late DMEM; early, treatment was started immediately after diabetes induction; late, treatment was started 30 days after diabetes induction.
