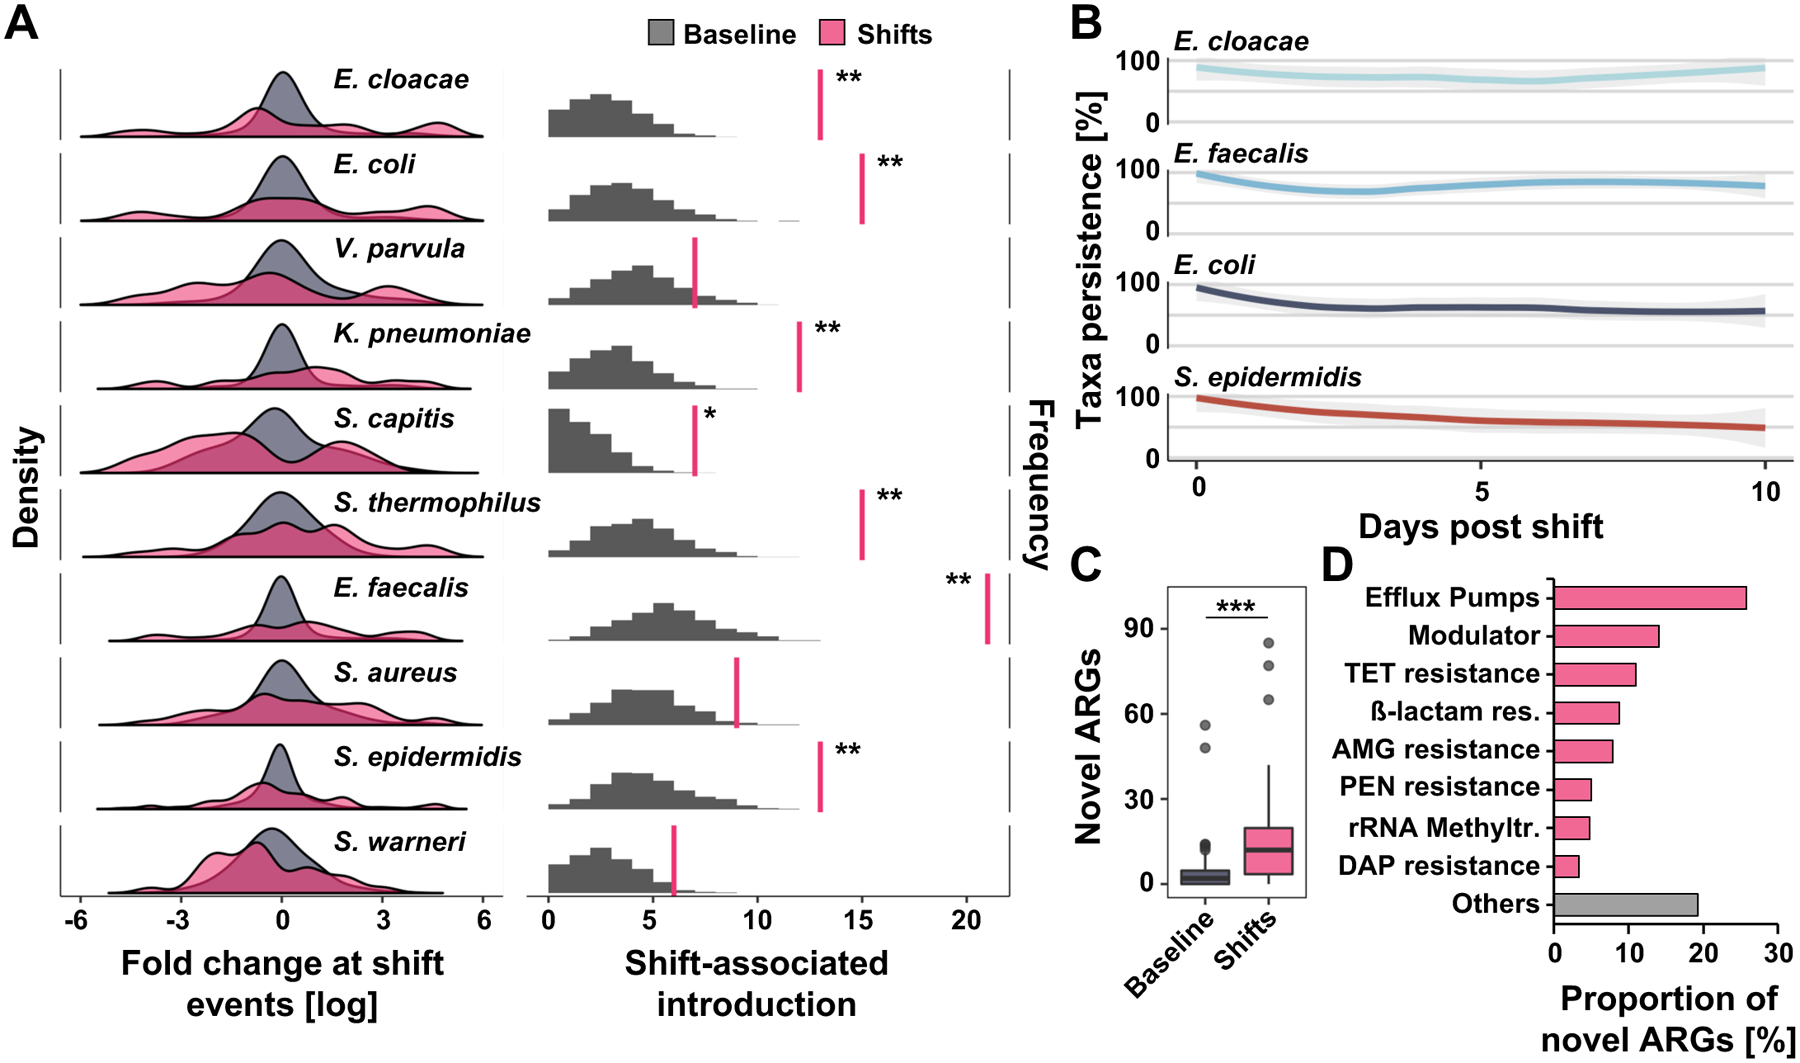
Figure 2 |. Antibiotic-induced microbiome shifts lead to abundance changes and introduction of pathobionts into the preterm infant gut.

A) The left panel demonstrates density (frequency of events, Y axis) for abundance changes (X axis) of selected species associated with shift events (pink) compared to 1000 permutations of baseline non-shift events (gray). Microbiome shifts are defined as Bray-Curtis dissimilarities between consecutive samples collected from the same patient that are ≥ Bray-Curtis dissimilarities between samples from unrelated individuals collected with the same time interval (Figure S3 A and B). Right panel depicts number of shift-associated discrete introduction events when metagenomically absent prior (right pink vertical line) compared to permutation of expected introductions in non-shift baseline samples (gray, n = 262, permutation test, FDR-adjusted, *P=0.05, **P<0.01). Full taxa and statistics appear in data file S19. B) Persistence (relative abundance greater than 0%) of selected taxa introduced at shift events over ten post-shift days. C) Number of antibiotic resistance genes (ARGs) introduced at shift events and undiscovered in pre-shift samples compared to permuted non-shift samples (n=262, Wilcoxon test P=3.49e−07). D) Classification of ARGs introduced at shift events. N=1479 samples from 96 infants.
