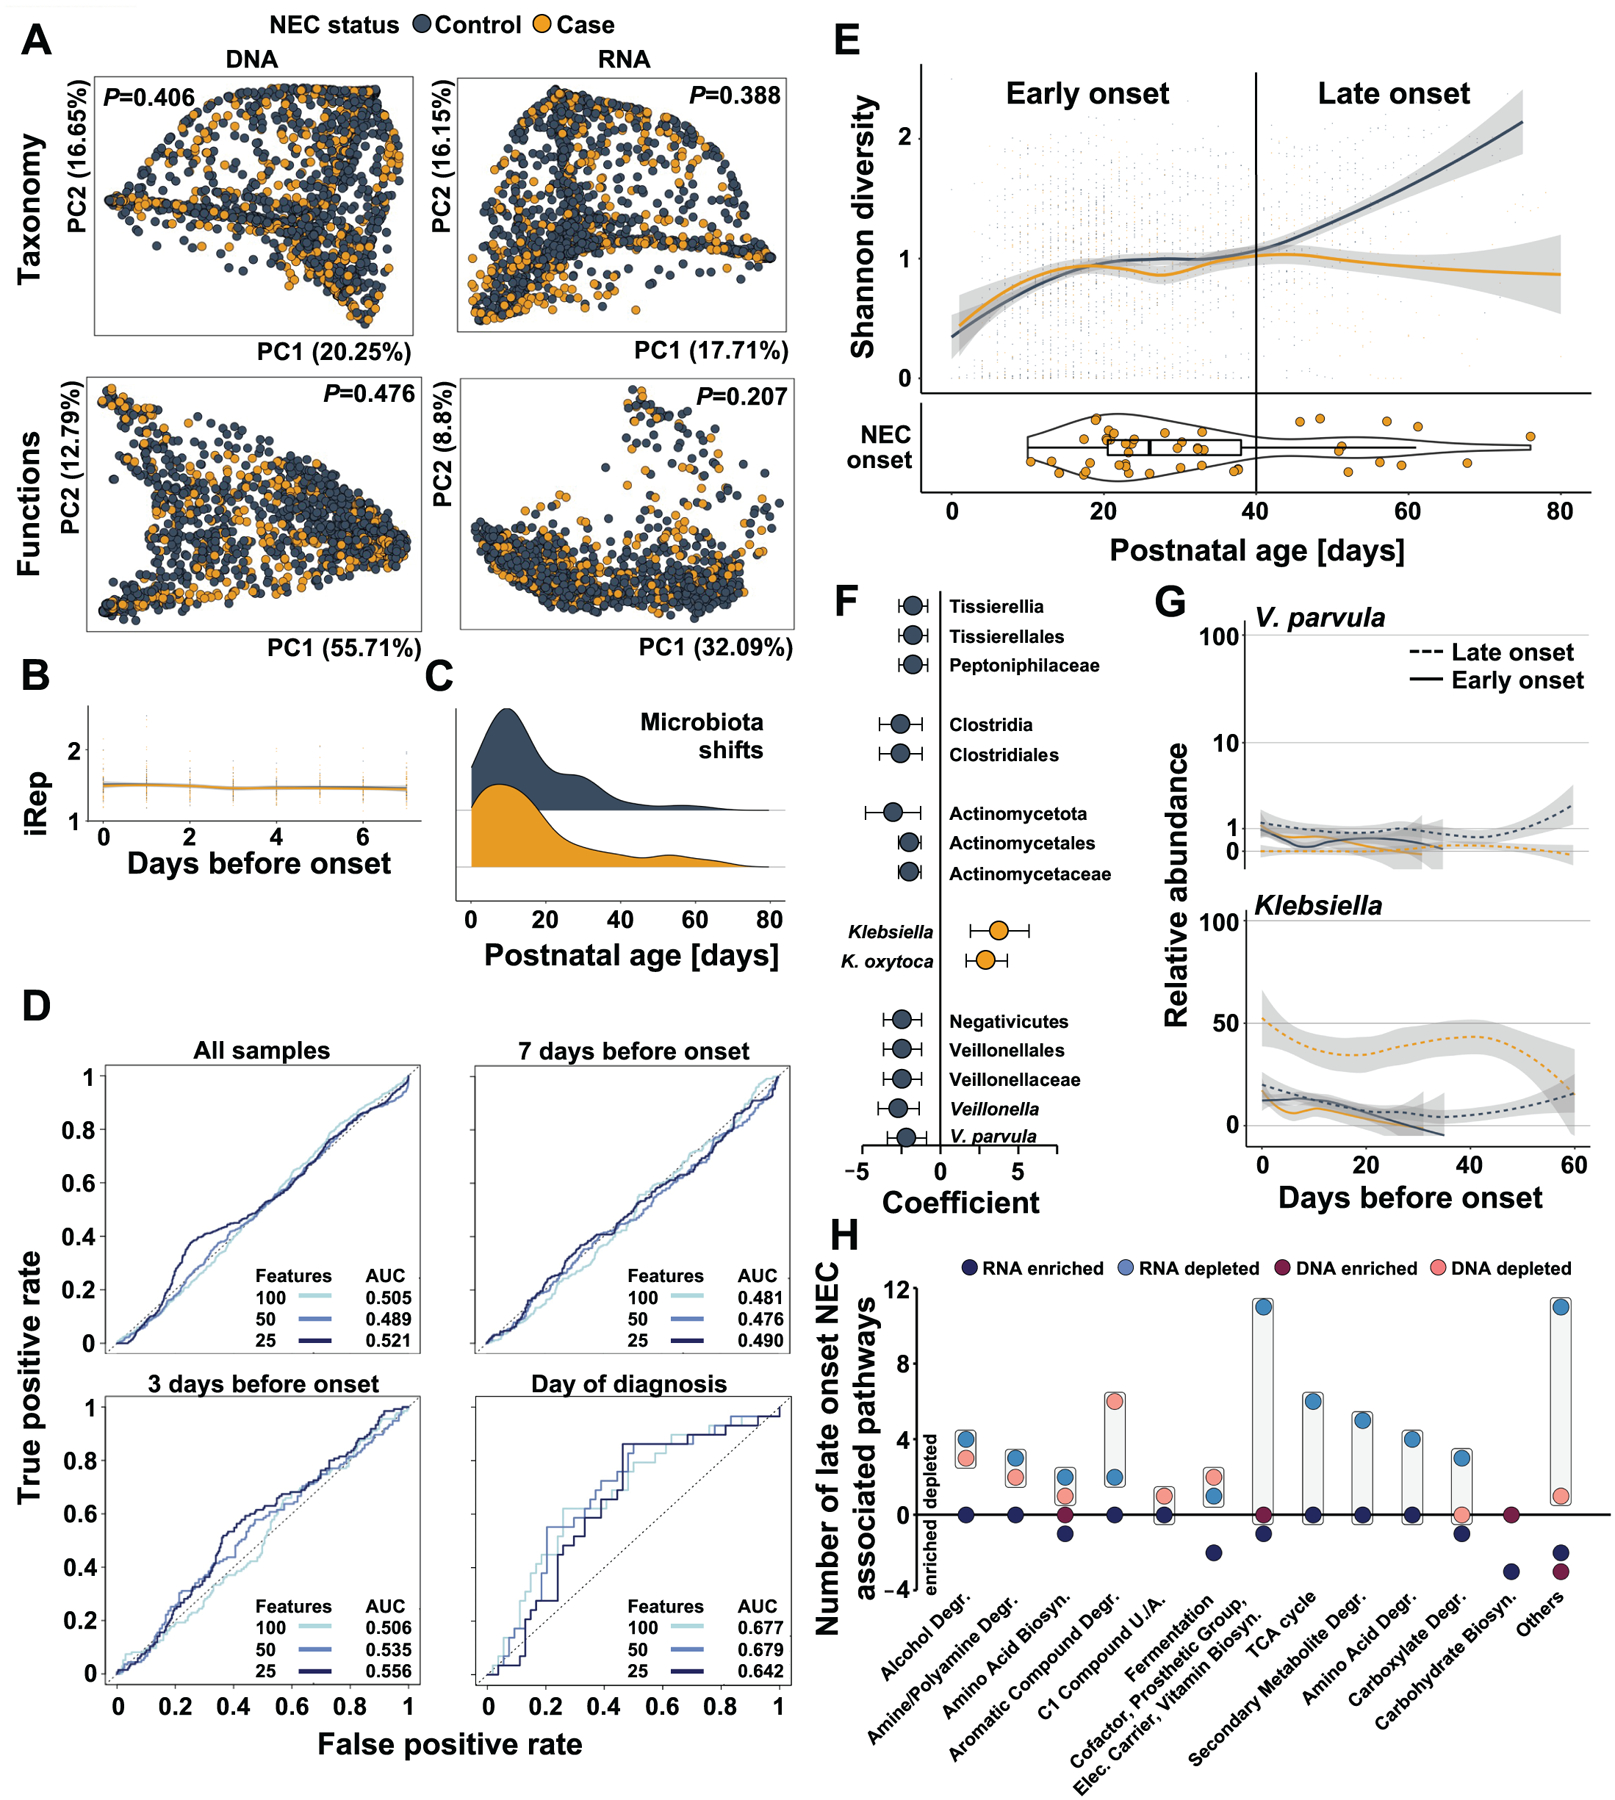
Figure 5 |. Gut microbiome features do not predict NEC onset for all preterm infants but differentiate late-onset cases and controls.

A) Principal coordinate analysis of pre-NEC gut microbiome taxonomic and functional composition in NEC cases (yellow) and matched controls (black). B) Bacterial replication rates in samples collected in the weak prior to NEC onset in cases (yellow) and matched controls (black, GLMM P>0.25). C) Distribution of microbiota shift events prior to disease onset in stool samples collected from NEC cases (yellow) and matched controls (black). D) Receiver operating characteristic curves of logistic regression models accounting for repeat measures utilizing all microbiome data collected from all samples, or samples taken in the week before, 3 days before, or at NEC onset. E) Shannon diversity of NEC cases (yellow) and matched controls (black) over postnatal days (top). Age of cases at disease onset in postnatal days (bottom). F) Taxa significantly associated with case or control status in late onset NEC when accounting for confounding exposures (MaAsLin2, q<0.25). G) Abundance of V. parvula (top) and Klebsiella (bottom) over 60 days before onset in early (solid) and late (dashed) NEC cases (yellow) and matched controls (solid). H) Functional pathway expression and abundance associated with late onset NEC. Boxes highlight the difference between the number of DNA-encoded or RNA-encoded pathways in cases vs controls. N=2103 samples from 144 infants.
