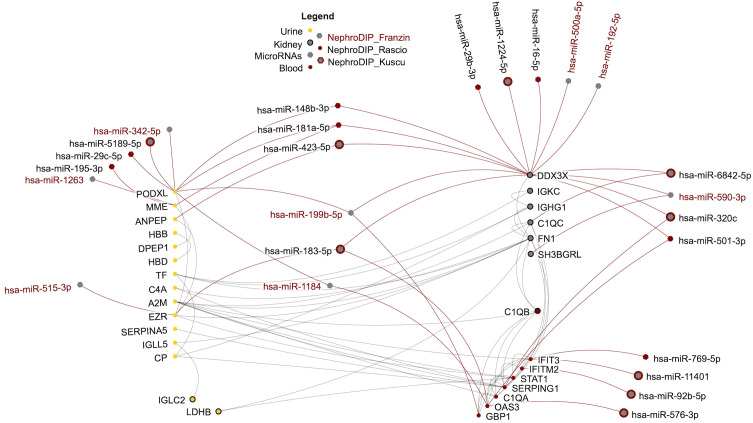
Figure 3.
Network of shared transcripts, proteins, and microRNAs differentially expressed in cABMR and predicted to regulate the shared molecules. The protein-protein interactions between the molecules are shown in grey and the regulation by microRNAs is in red. Each node in the network represents a molecule found in NephroDIP, while the edges represent either direct interaction between molecular nodes, or evidence of regulation (e.g. microRNA and gene). Proteins identified in urine are shown as yellow nodes. Red nodes indicate molecules identified in blood.

