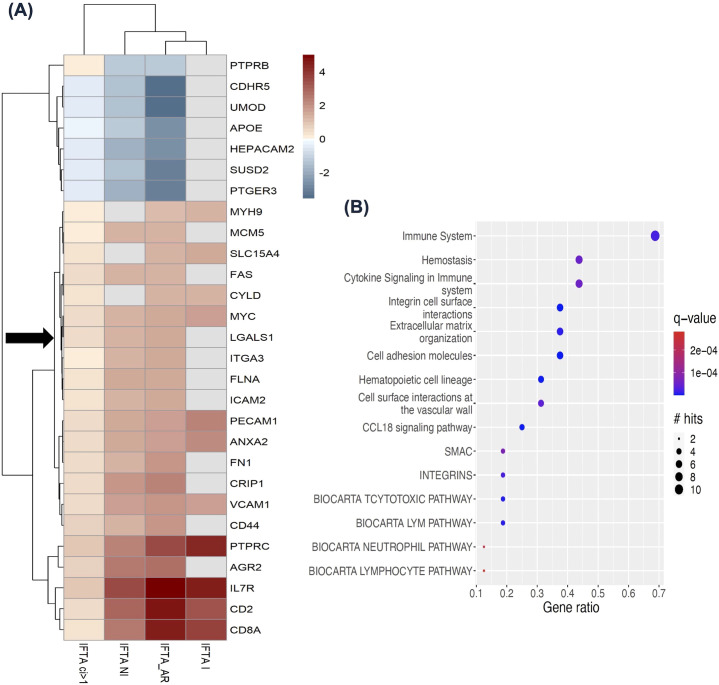
Figure 4.
LGALS1 and its interactome expression in the kidney allografts with interstitial fibrosis and tubular atrophy (IFTA), from Venner et al., 2016 and Modena et al., 2016 (36, 37). (A) Heatmap showing 28 LGALS1 interactor genes differentially expressed in at least 3/4 comparisons to normally functioning kidney transplants or kidney transplants with mild/no IFTA (ci</=1). Red color indicates increased expression and blue color indicates decreased expression. LGALS1 is denoted by black arrow. (B) Top 15 pathways enriched (FDR: BH<0.01) among the concordant interactors from (A) (red). The size of the circle indicates the number of LGALS1 interactors in the pathway, and the color indicates significance. IFTA, interstitial fibrosis and tubular atrophy; IFTA ci>1, interstitial fibrosis and tubular atrophy with at least moderate interstitial fibrosis score; IFTA-I, interstitial fibrosis and tubular atrophy with inflammation; IFTA-NI, interstitial fibrosis and tubular atrophy with no inflammation; IFTA-AR, interstitial fibrosis and tubular atrophy with acute rejection.

