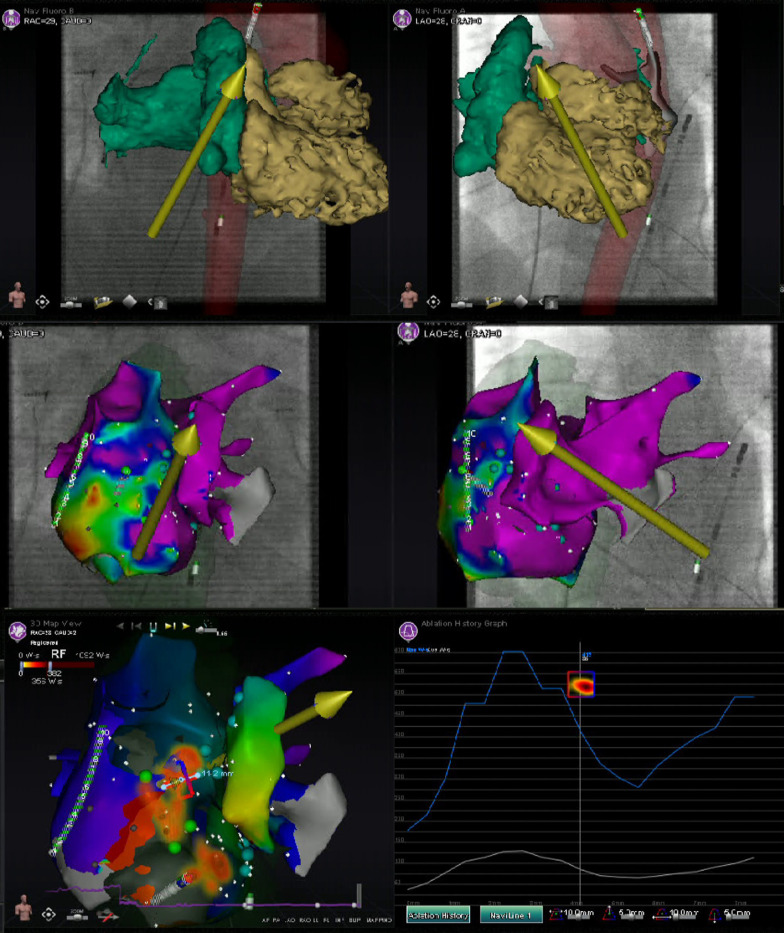
Figure 2.
Image integration. This figure shows the various screen outputs which are displayed in real-time to the operator during a RMN-guided ablation procedure utilizing image integration in a patient after congenital heart surgery. This patient had a single ventricle physiology, with a small RV, large ventricular septal defect and double inlet left ventricle with two AV valves. The patient previously underwent total cavo-pulmonary connection (TCPC) and the remaining RA is rather small. The upper panels show segmented 3D CMR scan images overlayed on the fluoroscopy images. The RMN magnetic vector is displayed as yellow arrow and the ablation catheter is also visualized. The middle panels show the CARTO bipolar voltage maps in two directions of the ventricle together with the RMN magnetic vector (yellow arrow) and the ablation catheter (retrograde approach). The native chambers have normal voltage, whereas the TCPC is large and has scar and that is where reentry was observed and atrial tachycardia originated. The left lower panel visualizes the applied therapy using the Ablation History feature's output on the activation map. The applied therapy is displayed in yellow-orange (see Figure 3 for a more detailed explanation). The right lower panel provides the so called Ablation History graph visualizing the applied energy. The various imaging modalities displayed are all fully integrated with the RMN system.

