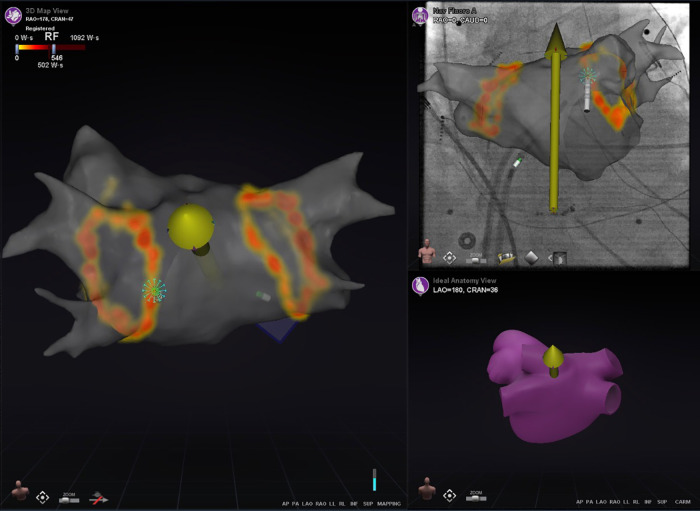
Figure 3.
The ablation history feature. This figure illustrates the Ablation History of a patient who underwent pulmonary vein isolation. The pulmonary veins were isolated by applying two Wide Area Circumferential Ablation (WACA) lines around the left-sided and right-sided pulmonary veins. The main panel represent the CARTO screen, on which the LA FAM map is displayed and made transparent. The applied energy during ablation is visualized 3-dimensionally from yellow to orange based on the applied Watt-Seconds per location. In this case, the ablation catheter is in optimal contact with myocardial tissue, which is evaluated by the e-Contact Module and displayed real-time to the user with a dense blue starburst at the catheter tip.

