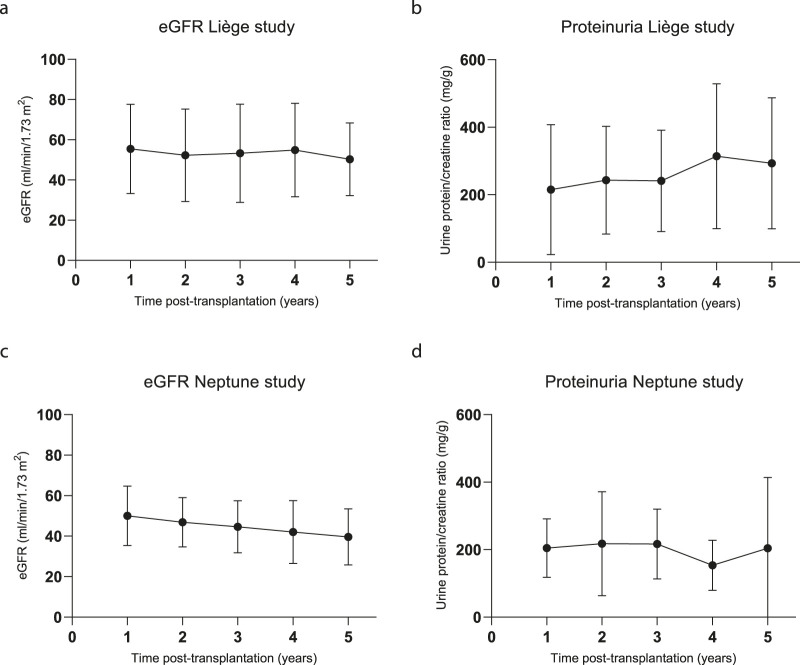
FIGURE 4.
Kidney function during the 5-year follow-up. (A) Estimated glomerular filtration rate (eGFR in mL/min/1.73 m2) calculated using the CKD-EPI formula for the Liège study patients; N = 10 for all time points. (B) Urine protein/creatinine (mg/g) ratios of the Liège study patients; n = 9, 8, 8, 7, and 8 for years 1, 2, 3, 4, and 5, respectively. (C) eGFR calculated using the CKD-EPI formula and (D) urine protein/creatinine ratios of the Neptune patients; n = 10, 10, 10, 9, and 8 for years 1, 2, 3, 4, and 5, respectively.

