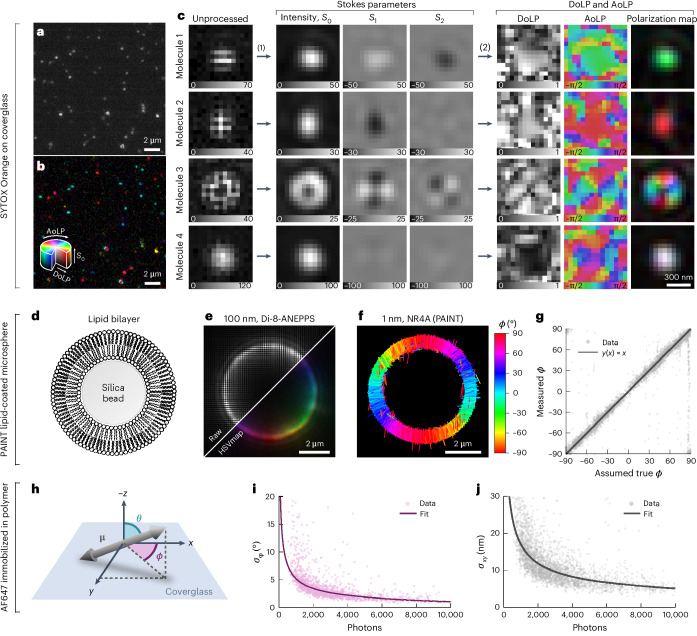
Fig. 2. Single-molecule detection, experimental bias and precision.
a, An unprocessed polarization camera image of SYTOX Orange molecules dispersed on a coverglass in PBS. b, The same image as in a but processed to reveal polarization information using a polarization color map that combines the AoLP, the DoLP and the intensity (S0) in HSV (hue, saturation, value) color space (hue, AoLP; saturation, DoLP; value, S0). c, Examples of four SYTOX Orange molecules with their emission dipole moment parallel to the sample plane (molecules 1 and 2), parallel to the optical axis (molecule 3) and rapidly rotating (molecule 4). For each, the unprocessed image, estimated Stokes parameter images (S0, S1 and S2), the AoLP, the DoLP and polarization color map images are shown. d, Illustration of a silica microsphere (5 μm in diameter) coated using a lipid bilayer (DPPC with 40% cholesterol). e, Diffraction-limited image of a cross-section at a z plane in the middle of a lipid bilayer-coated silica microsphere labeled using the membrane dye Di-8-ANEPPS. f, POLCAM SMOLM reconstruction of a cross-section of a lipid bilayer-coated silica microsphere acquired through PAINT with Nile red. Each localization is drawn as a rod with a direction indicating the estimated in-plane angle ϕ. g, An experimental bias curve for the estimation of ϕ generated using a PAINT dataset such as the one shown in f. h, Illustration of the angles specifying the orientation of the emission dipole moment. i,j, Experimental precision from repeated localization and orientation estimation on AF647 immobilized in polyvinyl alcohol (PVA). The precision is the measured standard deviation on repeated measurement of the position (x, y) (j) and the in-plane angle ϕ (i) of the same molecule. Photon numbers are averages. Measurements between n = 12 and n = 40 are used to calculate the standard deviation. A power law was fitted to the data.

