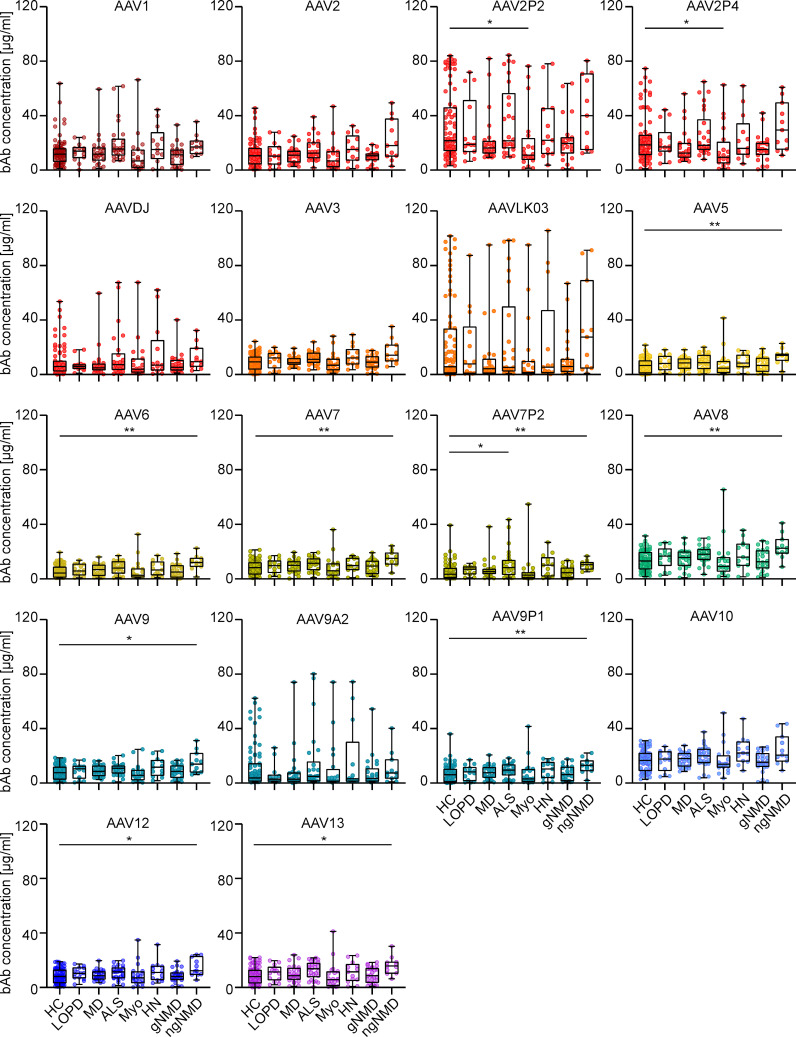
Figure 6.
Binding antibody data stratified by health status of serum donors. The binding antibody levels as shown in Figure 2 were stratified by the health status of the probands into eight groups: healthy controls (HC, n=76), late onset Pompe’s disease (LOPD, n=14), muscular dystrophies (MD, n=25), amyotrophic lateral sclerosis (ALS, n=26), myotonic disorders (Myo, n=20), hereditary neuro(no)pathies (HN, n=13), other genetic NMD (gNMD, n=24) and non-genetic NMD (ngNMD, n=11). Each dot represents one individual sample. Statistically significant differences in antibody levels compared to the group of healthy controls are indicated by asterisks (* p < 0.05; ** p < 0.01; Kruskal-Wallis one-way ANOVA on ranks and Dunn’s multiple comparisons test).

