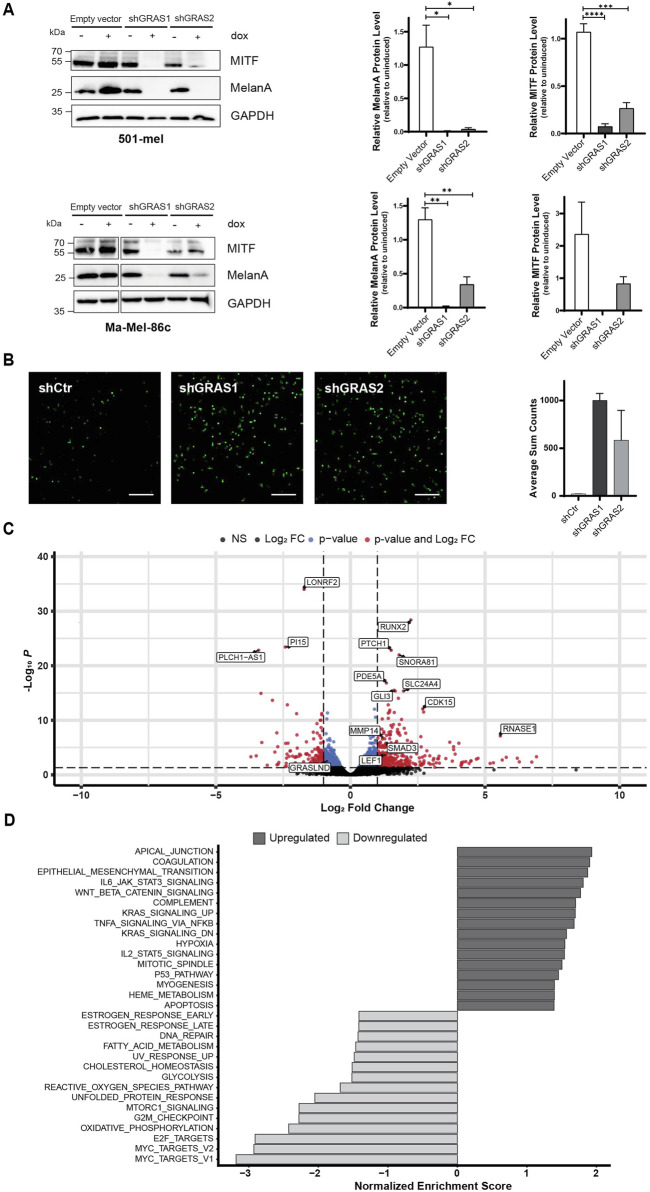
FIGURE 3.
GRASLND knockdown induces melanoma phenotype switching. (A) Expression of melanoma differentiation marker MITF and MelanA after GRASLND knockdown in 501-mel (top) and Ma-Mel-86c cells (bottom) induced with doxycycline (2 μg/mL) for 72 h analyzed by Western blotting (left), GAPDH as loading control. Quantification of MITF and MelanA levels given as mean ± SEM. p-values by two-sided t-test (right). Representative blot out of n = 3 independent biological replicates. (B) Representative images (left) and quantification (right) of 501-mel shRNA-knockdown cell lines induced with doxycycline (2 μg/mL) for 72 h and subsequently subjected to a Transwell invasion assay. n = 2 independent biological replicates. Scale bar = 25 µm. (C) Volcano plot of differentially expressed genes after shRNA-mediated GRASLND knockdown by shGRAS1 and shGRAS2 compared to shCtr using RNA-Sequencing. Stable shRNA knockdown cells of cell line 501-mel were induced for shRNA expression for 72 h. Medium was exchanged every day. The two vertical lines represent the thresholds for a log2FoldChange, while the horizontal line denotes the threshold for statistical significance (adjusted p < 0.05). Red dots indicate genes with statistically significant up- or downregulation. (D) Gene set enrichment analysis (GSEA) of affected pathways after GRASLND knockdown using the Hallmark pathway gene sets (https://CRAN.R-project.org/package=msigdbr). Top 16 enriched pathways of upregulated and top 15 enriched pathways of downregulated genes are shown. NS = non-significant, FC = Fold Change.

