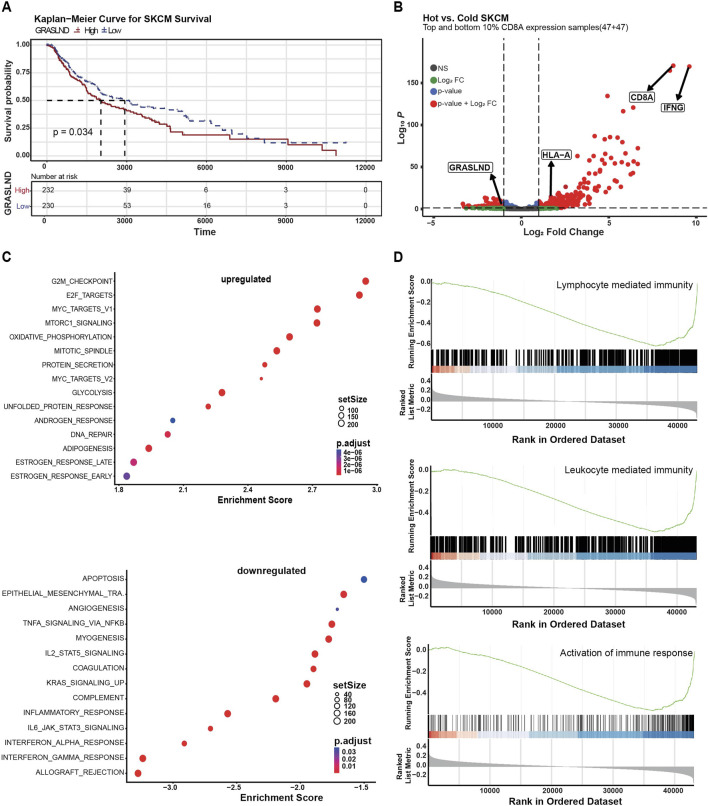
FIGURE 4.
GRASLND is enriched in immune cold melanoma. (A) Melanoma patient survival plot (TCGA, SKMC) based on GRASLND high (n = 232) and low (n = 230) groups. Two-sided log-rank test for p-value. (B) Human melanoma samples (TCGA, SKCM) were divided into hot and cold tumor groups based on CD8A transcript levels, indicating the abundance of immune infiltrates. Volcano plot shows top and bottom 10% CD8A expression samples and fold changes and p values of transcripts. Statistical analysis was performed using two-sided t-tests. (C) Gene set enrichment analysis of GRASLNDhigh melanoma patient samples (n = 232) tumors using the Hallmark pathway gene sets. Top 15 upregulated (top) and top 14 downregulated (bottom) pathways are shown. (D) Single gene set enrichment of GRASLNDhigh melanoma patient samples (n = 232) for genes involved in the activation of immune response, leucocyte-mediated immunity and lymphocyte mediated immunity. The curves represent the running sum of the enrichment scores and the bars represent the position of genes associated with specific pathways. In the bottom part, the distribution of fold change along with the gene list is shown.

