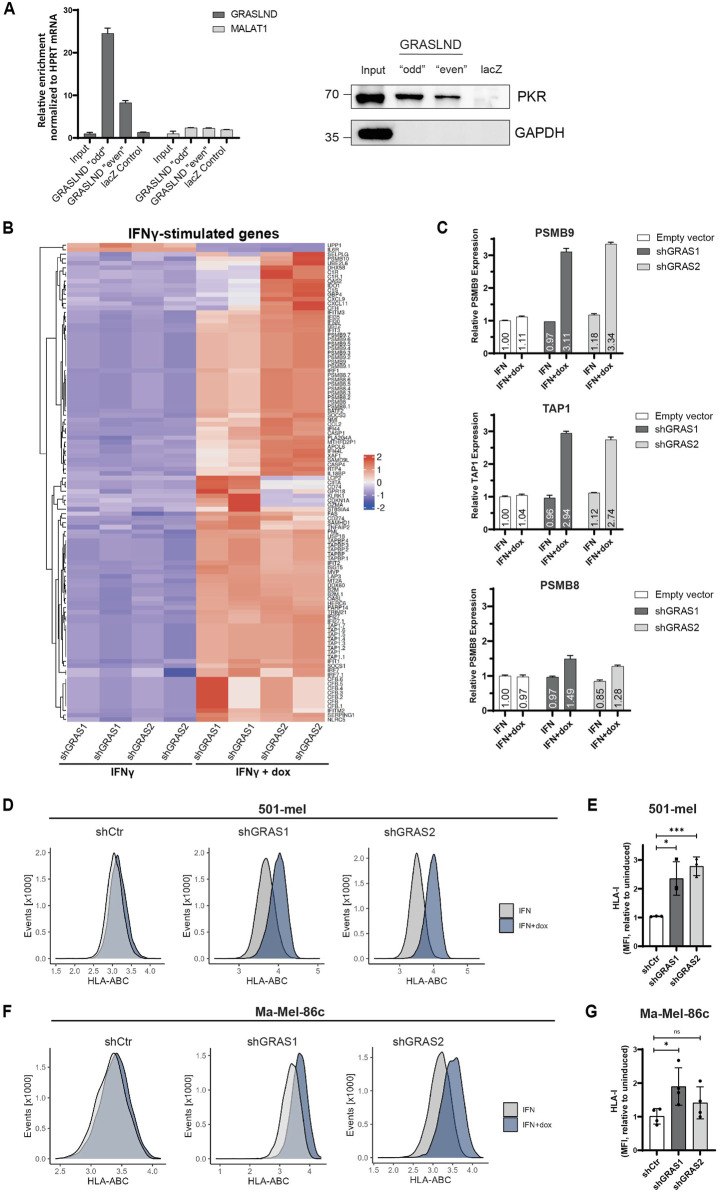
FIGURE 5.
GRASLND impairs HLA-I upregulation under IFNγ. (A) RNA pulldown of GRASLND followed by Western blot analysis. Left panel shows GRASLND enrichment validated by RT-qPCR and normalized to HPRT1 mRNA levels. Right panel shows Western blot of PKR subsequent to GRASLND pulldown. Representative data of three independent experiments. (B) Heatmap of differentially expressed IFNγ-stimulated genes after IFNγ treatment and shRNA-mediated GRASLND knockdown for 6 days using RNA-Sequencing. (C) Relative RNA expression confirmation of ISGs examples PSMB9, TAP1 and PSMB8 after GRASLND knockdown and simultaneous treatment with IFNγ for 3 days, determined by RT-qPCR and normalized to GAPDH mRNA levels. (D) HLA-I surface expression in 501-mel cells determined by flow cytometry. Representative histograms of control and GRASLND knockdown cell lines from independent biological replicates (n = 3). (E) Fold change of MFI of IFNγ-only to IFNγ+dox treated cells given as mean ± SD in 501-mel cells. (F) HLA-I surface expression in Ma-Mel-86c cells determined by flow cytometry. Representative histograms of control and GRASLND knockdown cell lines from independent biological replicates (n = 4). (G) Fold change of MFI of IFNγ-only to IFNγ+dox treated cells given as mean ± SD in Ma-Mel-86c cells.

