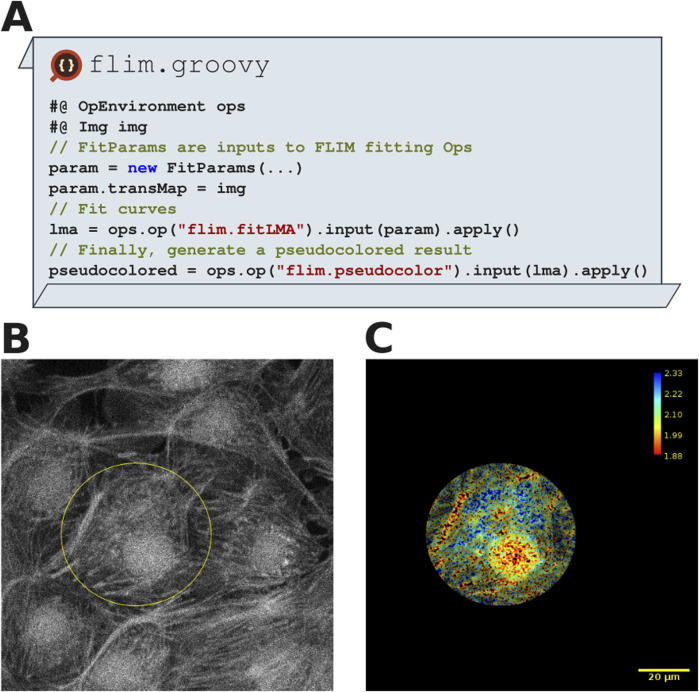
FIGURE 8.
FLIM analysis shows a separation of three fluorescence components in a MitoTracker Red, Alexa Fluor 488 and DAPI labeled fixed BPAE cell sample (FluoCells Prepared Slide#1, ThermoFisher). (A) Excerpts from FLIM analysis script using SciJava Ops which was run in Fiji. (B) A 2D FLIM image of BPAE cells, imported into Fiji using Bio-Formats. An elliptical ROI has been drawn around a single cell using the ImageJ Elliptical selection tool. (C) FLIM analysis within SciJava Ops yields pseudo colored result images (with corresponding color bar), which could be further processed using other Ops. Note that script results were restricted to the elliptical ROI drawn in (A). The scale bar is 20 µm and the FLIM lookup table reads 1.88 ns–2.33 ns.

