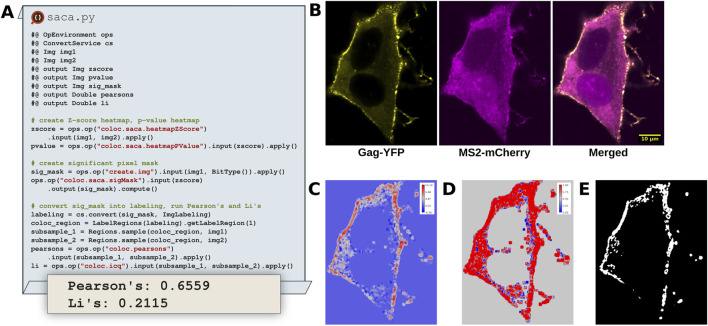
FIGURE 9.
SACA on dual color fluorescent HIV-1 construct expressed in HeLa cells identifies colocalization regions of interest. (A) Excerpts of a Python Fiji script that utilizes the SACA framework implemented in SciJava Ops to detect regions of colocalization and determine the degree of colocalization. (B) Input images of HIV-1 Gag-YFP, MS2-mCherry proteins, tracking colocalized viral particle production and viral mRNA trafficking dynamics at the plasma membrane. (C) Z-score heatmap of input data, indicating the strength of colocalization. (D) Pixel-wise p-value heatmap of the Z-score colocalization strength. (E) Significant pixel mask indicating which pixels are significantly colocalized in the input data.

