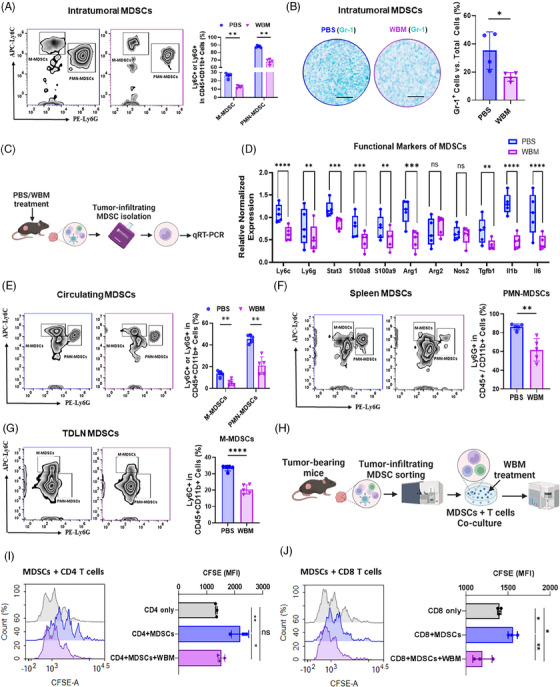
FIGURE 2.

Impact of WBM extract on MDSC presence and activity in the TRAMP‐C2‐C57BL/6J mouse model. (A) Flow cytometry results show intratumoural M‐MDSCs (CD11b+/Ly6C+/Ly6G−) and PMN‐MDSCs (CD11b+/Ly6G+/Ly6C−) with respective quantitative comparisons (n = 5) between PBS‐ and WBM‐treated groups. (B) The representative IHC images (scale bar = 400 µm, n = 4) highlight Gr‐1 expression (Teal) in tumours, and the bar graph represents the corresponding quantitative analysis comparing PBS and WBM treatments. (C) The schematic diagram shows the process for isolating tumour‐infiltrating MDSCs from TRAMP‐C2 xenograft tumours in C57BL/6J mice treated with PBS or WBM extract for qRT‐PCR analysis. (D) The box plot compares the relative expression levels of key MDSC genes (Ly6C, Ly6G, Stat3, S100a8, S100a9, Arg1, Arg2, Nos2, Tgfb, Il1b, Il6) in tumour infiltrating MDSCs extracted from xenograft tumours treated with either PBS or WBM (n = 5). The flow cytometry results and corresponding quantitative comparisons of (E) circulating M‐MDSCs and PMN‐MDSCs, (F) spleen M‐MDSCs and PMN‐MDSCs, and (G) M‐MDSCs and PMN‐MDSCs in tumour‐draining lymph nodes (TDLNs) between PBS‐ and WBM‐ treated groups (n = 5). (H) Schematic illustration of tumour‐infiltrating MDSC isolation for MDSCs‐CD4/CD8 T cells co‐culture assay in the presence of WBM extract (10 µg/mL). The mean fluorescence intensity (MFI) of (I) CFSE‐positive CD4 T cells and (J) CFSE‐positive CD8 T cells was detected as an index of proliferative CD4/CD8 T cells. Statistical evaluations were performed using one‐way ANOVA with Tukey's post‐test for multiple comparisons. Significance notations: ns (non‐significant), *p < .05, **p < .01, ***p < .001, ****p < .0001.
