
FIGURE 4.
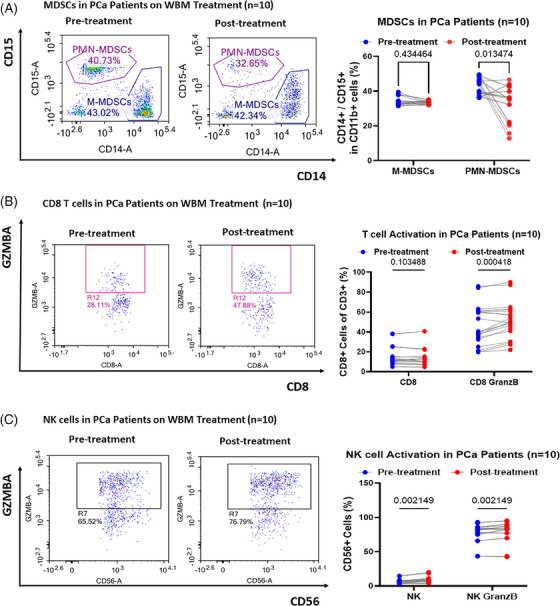
Impact of WBM consumption on circulating MDSCs, T, and NK cell dynamics in prostate cancer (PCa) patients. Flow cytometry results show the level of (A) circulating M‐MDSCs (CD11b+/CD14+) and PMN‐MDSCs (CD11b+/CD15+), (B) active CD8+ T cells (CD8+/Granzyme B+), and (C) active NK cells (CD56+/Granzyme B+) in PCa patients’ whole blood samples (n = 20, paired samples from 10 patients) collected at timepoint of pre‐treatment (first days of enrolment) and post‐treatment (3 months post‐WBM treatment). Each subfigure has a corresponding pairwise line‐point scatter plot, quantifying cell counts in patient blood samples taken pre‐ and post‐treatment. Data are presented using pairwise line‐spot plots and analysed using ordinary one‐way ANOVA with Tukey's post‐test for multiple comparisons. Significance levels are noted as ns (non‐significant), *p < .05, **p < .01, ***p < .001, ****p < .0001.