FIGURE 6.

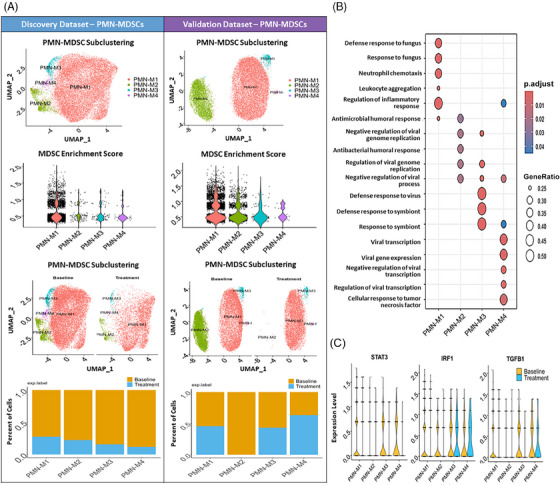
Impact of WBM intake on PMN‐MDSCs numbers and function in prostate cancer patients at the single‐cell level. (A) Unbiased Seurat clustering analysis of putative PMN‐MDSCs in a UMAP, identifying four distinct subclusters (PMN‐M1–M4) in both the discovery and validation dataset. The violin plots demonstrate the relative MDSC scores across the four putative PMN‐MDSC clusters in each dataset, showing similar levels of MDSC gene signature expression. The feature plot and bar chart show the changes in each putative PMN‐MDSC cluster post‐treatment, indicating a reduction across all four clusters in discovery dataset and one cluster in validation datasets. (B) The bubble plot represents Gene Ontology Biological Process (GO‐BP) gene signature scores for the PMN‐MDSC clusters from discovery dataset. The bubble shading indicates p‐value significance, and the bubble size corresponds to the number of genes associated with each process. (C) The violin plots show the expression levels of STAT3, IRF1 and TGFB1 within each PMN‐MDSC cluster from discovery dataset, providing insights into the gene expression within these cells.
