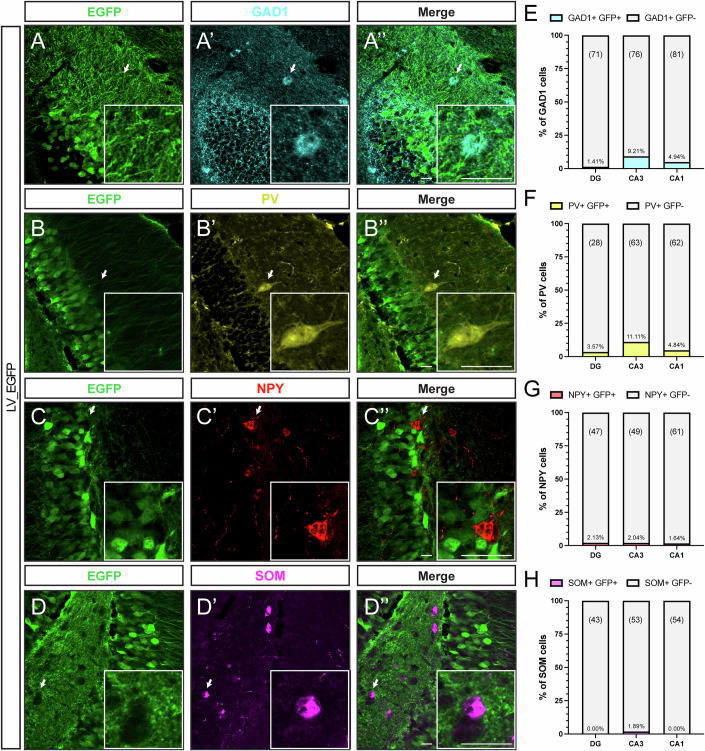
Figure 4. mCamKII(0.4) promoter-driven expression of EGFP in hippocampal interneurons.
(A-A”, B-B”, C-C”, D-D”) Representative confocal images of the dentate gyrus (DG) of fluorescently immunolabeled glutamate decarboxylase 1 (GAD-1, cyan), parvalbumin (PV; yellow), neuropeptide Y (NPY; red), somatostatin (SST; magenta) containing interneurons, together with EGFP (green) expression of animals transduced with LV-EGFP vector. Arrows indicate interneurons labeled with various markers and lacking EGFP signal. Scale bars = 20 µm. (E–H) Percentage of EGFP-expressing cells of the different interneuron sub-types in DG, CA3, and CA1 regions of the hippocampus. N = 3 mice. Number of examined cells in a given region is indicated above each bar. Source data are available online for this figure.

